

30+ Statistics on Crash Risk and Driver Behaviour (2025)
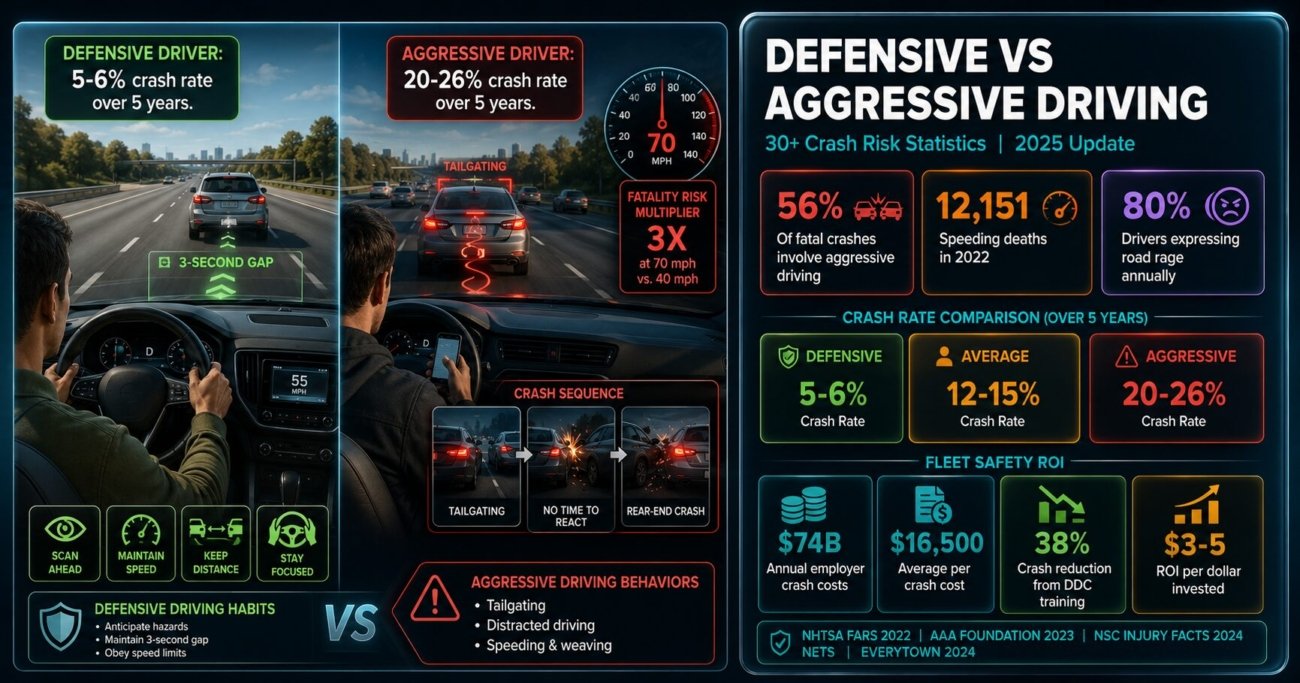
Aggressive driving is the most prevalent safety crisis on US roads that receives the least proportionate attention relative to its death toll. NHTSA data shows that speeding alone killed 12,151 people in 2022, accounting for 29% of all traffic fatalities. Aggressive driving behaviours – speeding, tailgating, unsafe lane changes, running red lights, and road rage – are contributing factors in 56% of all fatal crashes nationally. Yet driver behaviour receives a fraction of the policy attention directed at vehicle safety systems and infrastructure.
The contrast with defensive driving outcomes is stark. Research on fleet drivers and insurance claims data consistently shows that drivers who apply defensive driving principles – maintaining following distance, scanning ahead, managing speed relative to conditions, and avoiding emotional responses to other drivers – have crash rates 3 to 5 times lower than their aggressive counterparts over comparable mileage.
Below we have compiled 30+ statistics and data points on defensive versus aggressive driving, covering fatality data, crash risk differentials, road rage trends, speeding impact, distracted driving, the commercial fleet context, and the documented impact of defensive driving training programmes in 2025.
1. US Traffic Fatality Overview: 2022-2024 Data
- US traffic fatalities peaked post-pandemic at 42,939 in 2021 – the highest total in 16 years – reflecting reduced traffic enforcement, increased risky driving behaviours during COVID-19 lockdowns, and resumed travel with established aggressive habits. (NHTSA Traffic Safety Facts 2021)
- The 2022 fatality total of 42,795 represented only a marginal improvement from 2021, with speeding-related deaths at 12,151 accounting for 29% of all traffic fatalities – the highest speeding-related share in over a decade. (NHTSA Traffic Safety Facts 2022)
- 2023 saw a reduction to approximately 40,990 fatalities – the first meaningful decline since the pandemic surge – with NHTSA early estimates for 2024 suggesting continued modest improvement toward approximately 39,000. (NHTSA 2023 FARS; NHTSA 2024 Early Estimates)
- Despite recent improvement, US traffic fatality rates remain significantly higher per capita than peer nations. The US fatality rate of approximately 12.7 per 100,000 population compares to rates of 3-5 per 100,000 in the UK, Germany, Sweden, and Japan – nations with stronger speed enforcement and driver training cultures. (OECD Road Safety Annual Report 2024)
2. Aggressive Driving: Prevalence and Fatality Contribution
- NHTSA defines aggressive driving as occurring when an individual commits a combination of moving traffic offences so as to endanger other persons or property. By this definition, aggressive driving is a contributing factor in 56% of all fatal crashes in the United States. (NHTSA; AAA Foundation)
- AAA Foundation’s Traffic Safety Culture Index found that 80% of US drivers reported expressing significant anger, aggression, or road rage while driving at least once in the preceding 12 months – a figure that has remained elevated since the post-pandemic period. (AAA Foundation Traffic Safety Culture Index 2023)
- 51% of drivers reported purposely tailgating another vehicle in the past year, and 47% reported yelling, honking, or gesturing in anger – making these the most prevalent individual aggressive driving behaviours by self-report. (AAA Foundation)
- Aggressive driving is distinct from road rage in NHTSA’s framework. Aggressive driving is a traffic violation; road rage is a criminal offence involving the intent to harm another person. The escalation pathway from aggressive driving to road rage is a documented feature of many multi-vehicle incidents. (NHTSA; IIHS)
3. Speeding: The Deadliest Aggressive Driving Behaviour
- Speeding increases crash risk through three mechanisms: it reduces reaction time available before a collision, increases stopping distance required to avoid a hazard, and increases crash severity because kinetic energy increases with the square of velocity. A vehicle travelling at 70 mph has nearly twice the kinetic energy of one at 50 mph. (IIHS; NHTSA)
- IIHS research on speed and fatality risk shows that for every 10 mph increase in impact speed above 50 mph, the probability of a fatality in a collision approximately doubles. This exponential relationship means that the gap in crash outcomes between 55 and 80 mph driving is not linear. (IIHS Speed Research 2021)
- Young drivers aged 15-24 account for 26% of speeding-related fatalities despite representing a smaller share of total driving miles. Male drivers in this age group are disproportionately overrepresented in speeding-related deaths. (NHTSA FARS 2022)
- Motorcycle riders account for a disproportionately high share of speeding-related fatalities. In 2022, 34% of motorcycle riders involved in fatal crashes were speeding at the time of the crash, compared to 18% of passenger car drivers. (NHTSA Traffic Safety Facts 2022)
- Speed cameras and automated speed enforcement reduce speeding by 30-70% in zones where they are deployed, according to IIHS and international data. Their limited deployment in the US relative to peer nations is a documented contributor to the US speed-related fatality rate differential. (IIHS; OECD Road Safety)
4. Road Rage: Escalation Data and Firearm Involvement
- Road rage incidents involving firearms have increased dramatically since 2016. Everytown for Gun Safety and the Gun Violence Archive document more than 500 people shot in road rage incidents annually in recent years, with approximately 100-150 of those incidents resulting in deaths. (Everytown for Gun Safety; Gun Violence Archive 2023-2024)
- Everytown data shows road rage shootings increased from approximately 100 incidents in 2016 to over 400 incidents per year by 2021 – a four-fold increase in five years. This trend has continued to increase through 2024. (Everytown for Gun Safety Road Rage Report 2024)
- The majority of road rage incidents are triggered by minor traffic conflicts – a perceived cut-off, a failure to signal, a slow driver in the passing lane – rather than serious traffic violations. The escalation from minor conflict to physical confrontation is documented across the majority of road rage investigations. (AAA Foundation; NHTSA)
- AAA research found that drivers who felt anonymous – wearing sunglasses, driving alone, or in an unfamiliar area – were more likely to engage in aggressive and retaliatory driving behaviours. The anonymity effect is a documented psychological contributor to road rage escalation. (AAA Foundation)
- Men are significantly more likely to be both perpetrators and victims of road rage incidents. AAA data shows male drivers commit aggressive driving behaviours at higher rates across all measured categories, with the gap widest in the most extreme behaviours including vehicle ramming and physical confrontation. (AAA Foundation Traffic Safety Culture Index)
- States with higher rates of concealed carry permits show correlations with higher rates of road rage firearm incidents in research by Everytown and Giffords Law Center, though causal relationships are complex and subject to ongoing research. (Everytown; Giffords Law Center 2023)
5. Defensive Driving: Crash Risk Differential Data
- Fleet safety research consistently shows that drivers categorised as aggressive based on telematics data have crash rates 3 to 5 times higher than those categorised as defensive over comparable mileage. The differential is largest for at-fault crashes and crashes involving rear-end collisions. (NSC; NETS Network of Employers for Traffic Safety)
- The 3-second following distance rule – maintaining at least 3 seconds of gap between your vehicle and the vehicle ahead – is the single defensive driving technique with the highest impact on rear-end crash prevention. Rear-end collisions are the most common type of crash on US roads, accounting for approximately 29% of all crashes. (NHTSA; NSC)
- Defensive drivers who scan 12-15 seconds ahead rather than 3-5 seconds ahead have more time to identify and respond to developing hazards before they require emergency braking or evasive manoeuvring. The scanning distance translates to approximately 600-750 feet at highway speeds – sufficient to identify most developing hazards before they require emergency response. (NSC Defensive Driving Curriculum)
6. Distracted Driving: The Intersection With Aggressive Behaviour
- NHTSA reported 3,308 people killed in distraction-affected crashes in 2022, down slightly from 3,522 in 2021. However, distracted driving fatalities are widely considered undercounted because phone use is often not listed in crash reports unless directly observed or disclosed. (NHTSA Traffic Safety Facts 2022)
- AAA Foundation research found that nearly half of all US drivers read a text or email while driving in the prior 30 days, and 35% typed a text or email while driving. These behaviours are most common in the 19-24 age group but prevalent across all adult ages. (AAA Foundation Traffic Safety Culture Index 2023)
- Sending or reading a text takes a driver’s eyes off the road for an average of 5 seconds. At 55 mph, 5 seconds of distraction covers the length of a football field – the equivalent of driving the length of a full American football field with eyes closed. (NHTSA Distracted Driving Research)
- Distracted driving and aggressive driving co-occur at higher rates than either behaviour alone. Drivers who self-report aggressive driving tendencies are also more likely to use phones while driving, suggesting a common underlying risk-tolerance profile rather than independent behaviours. (AAA Foundation Research)
- Hands-free phone use reduces manual distraction but does not eliminate cognitive distraction. NHTSA and NSC research shows that hands-free conversations impair driving performance nearly as significantly as hand-held conversations because the cognitive load of conversation reduces hazard detection. (NSC; NHTSA)
7. Commercial Fleet and Occupational Driving: Safety Programme Data
- Motor vehicle crashes are the leading cause of work-related deaths in the United States, accounting for approximately 38% of all occupational fatalities. This makes vehicle safety – and defensive driving – the single highest-impact occupational safety intervention available to most employers. (BLS CFOI 2022; NSC)
- The National Safety Council estimates that motor vehicle crashes cost US employers approximately $74 billion annually in medical costs, legal expenses, property damage, lost productivity, and administrative costs. The average on-the-job crash costs an employer $16,500 even without serious injury. (NSC Injury Facts 2024)
- Fleet telematics programmes that provide real-time feedback on speeding, hard braking, rapid acceleration, and cornering consistently produce measurable improvements in driver behaviour and crash rates when paired with coaching. Studies document 20-40% crash rate reductions in the 12 months following telematics programme implementation. (NETS; IIHS Telematics Research)
- FMCSA’s Commercial Motor Vehicle Safety data shows that driver behaviour is a contributing factor in approximately 87% of large truck crashes where the truck was the initiating vehicle. Speed and following distance are the two most frequently cited driver behaviour factors. (FMCSA Large Truck Crash Causation Study)
8. Defensive Driving Training: Documented Outcomes
- NSC Defensive Driving Course (DDC) studies show participants experience crash rates 20-38% lower than non-participants in the 2-3 years following course completion. The benefit is most pronounced for rear-end crashes and intersection crashes – the categories most directly addressed by defensive driving techniques. (NSC DDC Outcome Studies)
- Insurance premium discounts for completing an approved defensive driving course average 5-15% across US states that mandate insurer discounts. In 2024, 35 US states and Washington DC offer statutory premium discounts for defensive driving course completion. (Insurance Information Institute 2024)
- Online defensive driving courses that include interactive hazard perception testing produce better outcomes than lecture-format online courses without hazard perception components. Hazard perception – the ability to identify developing hazards before they require emergency response – is the most predictive measured skill for crash involvement. (IIHS; NHTSA Driver Research)
- Employer-sponsored defensive driving programmes that include individual telematics feedback paired with coaching produce 2-3x better outcomes than classroom-only programmes without personalised feedback. The feedback-coaching combination allows drivers to connect their specific behaviours to crash risk data. (NETS; NSC)
- Young drivers aged 16-24 show the greatest improvement from defensive driving training, reflecting both their higher baseline crash rates and their greater response to skill-based intervention compared to experienced drivers with established habits. Graduated licensing combined with defensive driving training produces the largest documented young driver safety improvement. (IIHS Graduated Licensing Research; NSC)
Key Takeaways for Drivers and Fleet Safety Managers
Sources
Government and Regulatory
- NHTSA: Fatality Analysis Reporting System (FARS) – 2022 and 2023 Fatality Data
- NHTSA: Traffic Safety Facts 2022 – Speeding (12,151 deaths; 29% of fatalities)
- FMCSA: Large Truck Crash Causation Study (87% driver behaviour factor)
Industry and Research Sources
- AAA Foundation for Traffic Safety: Traffic Safety Culture Index (80% road rage; aggressive behaviour prevalence data)
- IIHS: Speed Research (2x fatality risk per 10 mph above 50; speed camera effectiveness)
- NSC Injury Facts 2024: Motor Vehicle Crash Costs ($74B annual employer cost)
- NETS: Fleet Safety Research (38% crash reduction; $3-5 ROI on defensive driving)
- Everytown for Gun Safety: Road Rage Shootings (500+ shot annually; 4x increase since 2016)
- OECD: Road Safety Annual Report 2024 (US vs peer nation fatality rate comparison)