


Calibration is one of those program areas where the gap between what organizations believe they have and what auditors actually find can be substantial. The equipment gets tagged. The spreadsheet gets updated. And then an FDA inspector arrives, or an ISO audit begins, and the cracks become visible: overdue instruments still in service, OOT events with no batch impact assessment, interval decisions that cannot be justified. These are not rare failures. They are the most common findings across manufacturing, pharmaceutical, and laboratory environments.
The data in this article comes from regulatory bodies, accreditation organizations, market research firms, and calibration standards. Below we have compiled 40+ statistics on calibration program compliance, OOT event frequency and cost, digital adoption rates, industry-specific requirements, and what separates programs that pass audits from those that do not.
Editor's Choice: Key Calibration Statistics
1. Calibration Program Market Size and Adoption Statistics
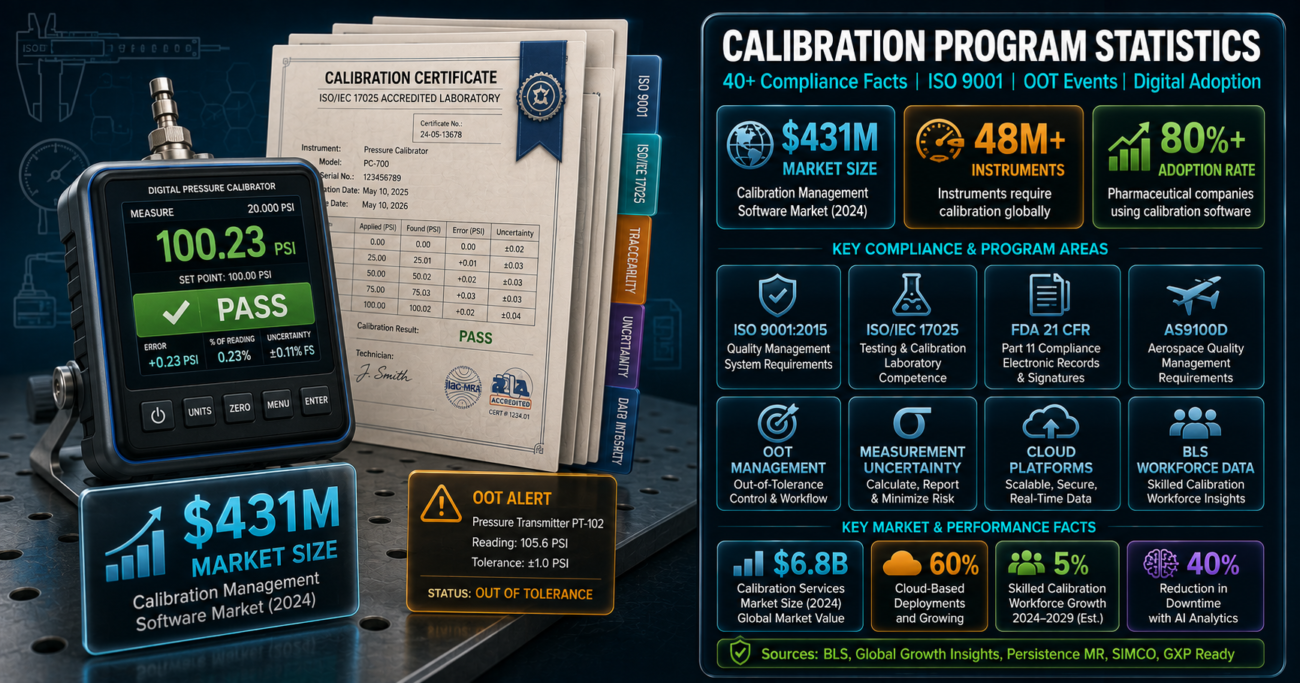
- The calibration management software market was valued at $431.1 million in 2025, growing from $405.13 million in 2024, driven by tightening ISO and FDA requirements. (Global Growth Insights, 2025)
- Cloud-based platforms now hold 60% of calibration software deployments, up significantly from five years prior, enabling multi-site operations to maintain consistent calibration records. (Global Growth Insights, 2025)
- The global calibration services market – covering third-party and in-house calibration services – is expected to grow from $6.8 billion in 2026 to $10.1 billion by 2033. (Persistence Market Research, 2025)
- Over 48 million active measurement instruments require scheduled calibration globally in 2025, spanning manufacturing, laboratories, aerospace, telecom, and energy. (SNS Insider, 2025)
- The U.S. calibration services market alone is projected to grow from $2.07 billion in 2025 to $3.48 billion by 2035, supported by FDA, FAA, NIST, and ISO enforcement. (SNS Insider, 2025)
- IoT integration in calibration software reduced equipment downtime by 30% in 2024, while AI-powered predictive features introduced in 2023 achieved a 40% downtime reduction. (Global Growth Insights, 2025)
2. Calibration Adoption by Industry Sector
- Over 80% of pharmaceutical companies had implemented calibration management software by 2025, driven by FDA 21 CFR requirements and GMP inspection pressure. (Global Growth Insights, 2025)
- 50% of manufacturing units use calibration management software specifically for ISO compliance tracking, reflecting quality management system certification requirements. (Global Growth Insights, 2025)
- Aerospace adoption sits at approximately 35%, lower than pharmaceuticals despite stringent AS9100 and AS9003 requirements, reflecting longer procurement cycles. (Global Growth Insights, 2025)
- IoT-enabled calibration software usage rose by 20% in 2024, connecting equipment directly to calibration platforms for automated recall scheduling and remote data access. (Global Growth Insights, 2025)
- Partnerships between calibration software providers and healthcare companies increased by 20% in 2023, emphasizing customized solutions for medical device calibration under ISO 13485. (Global Growth Insights, 2025)
3. ISO Calibration Standards: What the Requirements Actually Specify
- ISO 9001:2015 Clause 7.1.5.2 does not prescribe specific calibration intervals – organizations must determine appropriate frequencies based on equipment type, usage, criticality, and accuracy requirements, and document that determination. (ISO 9001:2015)
- ISO/IEC 17025:2017 requires calibration laboratories to report expanded measurement uncertainty on every calibration certificate – a step that organizations outsourcing calibration should verify is present, since many certificates omit it. (ISO/IEC 17025:2017)
- The five core requirements appearing across every major calibration standard are: traceability, documented intervals, uncertainty quantification, calibration status identification, and OOT response procedures. (STS Calibration, 2026)
- ISO 9001 calibration requirements apply specifically when measurement traceability is required, or when the organization considers it essential for confirming valid measurement results – in practice, this covers any instrument used for acceptance or rejection decisions. (ISO 9001:2015 Clause 7.1.5.2)
4. Out-of-Tolerance Event Statistics and Compliance Impact
- Under FDA 21 CFR 211.68 and EU GMP Chapter 6, OOT findings trigger immediate deviation – the instrument is removed from service, a deviation number is assigned, and root cause investigation must begin within 24 hours. (oxmaint.com Pharma Calibration Audit Checklist, 2026)
- OOT events without batch impact assessments are automatic major audit findings in GMP environments. Inspectors evaluate who investigated, which batches were affected, and what CAPA closed the gap. (GXP Ready, 2026)
- When an instrument is found OOT, all measurements taken since its last successful calibration must be considered suspect – meaning the cost of a single missed OOT investigation can extend back 6 to 12 months. (SIMCO, 2025)
- ISO 9001 and AS9100 require organizations to look backward after an OOT discovery through a process known as reverse traceability – revalidating prior measurements to determine what was affected. (SIMCO, 2025)
- OOT frequency is tracked as a KPI in leading programs – instruments with repeat OOT findings are flagged for interval shortening, replacement evaluation, or environmental investigation rather than repeated repair cycles. (oxmaint.com, 2026)
- One pharmaceutical site reported moving from two 483 citations per year to zero in three consecutive FDA inspections after transitioning to digital calibration tracking with automatic QA escalations. (oxmaint.com, 2026)
5. Calibration Interval Statistics: Setting Frequencies That Hold Up in Audits
- ISO 9001 does not specify calibration intervals. Organizations must make evidence-based interval decisions – auditors look for documented rationale, not simply adherence to a generic fixed schedule. (ISO 9001:2015; Core Business Solutions, 2025)
- Manufacturer recommendations are a safe but often inefficient starting point – they tend to be conservative, leading to over-calibration and unnecessary cost without reducing risk. (F7i.ai, 2025)
- A data-driven interval approach uses baseline manufacturer guidance, criticality rating, usage frequency, historical OOT rate, and environmental conditions to optimize schedules after initial calibration cycles. (F7i.ai, 2025)
- A documented interval rationale – even a brief one covering usage frequency, criticality, and historical OOT rate – is significantly more defensible in audits than a uniform schedule applied across all equipment. (Calibration Awareness, 2026)
- Organizations can perform in-house calibration under ISO 9001 provided they ensure traceability, technician competence, documented procedures, and valid results. The standard does not require outsourcing. (Calibration Awareness, 2026)
6. Calibration Documentation: Common Audit Failures and Records Requirements
- The most common GMP calibration audit failures share a consistent pattern: overdue calibrations still in service, missing OOT investigation records, unclear procedures, and undocumented interval rationale. (GXP Ready, 2026)
- ISO 9001 calibration records must include dates, results, standards used, any adjustments made, and the name of the person performing calibration – all of these are reviewed during third-party audits. (QI-A, 2025)
- Calibration status identification – whether through labels, serial number cross-reference to a master log, or digital tracking – is one of the most frequently cited audit observations because it is easy for auditors to spot and is often poorly maintained. (David Barker Consulting)
- A 2025 audit of city vehicles found only 20% of preventive maintenance and 35% of safety inspections completed on time, underlining how calibration scheduling failures extend beyond laboratory environments. (Persistence Market Research, 2025)
- When calibration records are invalidated by OOT discovery, organizations under ISO 9001 must determine whether previously measured results were adversely affected and take appropriate action – documented evidence of this assessment is mandatory. (ISO 9001:2015 Clause 7.1.5.2)
7. Measurement Uncertainty: Statistics Most Programs Underinvest In
- Calibration does not produce perfect measurements – it produces measurements with quantified uncertainty, expressed at a defined confidence level, typically 95%. Pass/fail decisions at the edge of a tolerance limit require uncertainty analysis to be defensible. (calibration standards community)
- For most manufacturing applications, Type B uncertainty evaluation – derived from calibration certificates, manufacturer specifications, and historical data – is sufficient and required under ISO/IEC 17025. (ISO/IEC 17025:2017)
- Organizations outsourcing calibration should confirm that certificates include expanded uncertainty values, not merely pass/fail statements – a certificate without uncertainty reporting does not fully meet ISO/IEC 17025 requirements. (ISO/IEC 17025:2017)
- A pressure gauge reading 5% low on a boiler set to release at 150 PSI means the valve will not open until actual pressure reaches nearly 158 PSI – a safety risk that calibration uncertainty analysis is specifically designed to prevent. (F7i.ai, 2025)
8. Industry-Specific Calibration Requirements: Key Statistics by Sector
- In pharmaceutical manufacturing, the risk of a missed OOT investigation is not just a citation – it can trigger product recalls and batch quarantine extending back to the last confirmed calibration date. (GXP Ready, 2026)
- Aerospace calibration under AS9100 may require environmental simulation testing – altitude, temperature extremes – for instruments used in field conditions, going beyond what ISO 9001 demands. (standard industry guidance)
- Medical device manufacturers under ISO 13485 must retain calibration records for the entire life of the device, creating long-term documentation requirements that exceed those in most other sectors. (ISO 13485:2016)
- FDA 21 CFR 820 requires medical device manufacturers to establish and maintain procedures for inspection, measuring, and test equipment, including calibration status identification, storage controls, and corrective action when equipment is found out of tolerance. (FDA 21 CFR Part 820)
9. Digital Calibration Management: Adoption Trends and Operational Impact
- Cloud-based calibration platforms hold 60% of the software deployment market, the dominant delivery model because they support multi-site access, automatic updates, and integration with existing quality management systems. (Global Growth Insights, 2025)
- AI-powered predictive maintenance features in calibration software reduced equipment downtime by up to 40% in 2023 by identifying instruments trending toward OOT before the scheduled calibration date. (Global Growth Insights, 2025)
- Beamex launched a cloud-based calibration platform with enhanced analytics in 2023, while Fluke Calibration released a mobile-friendly calibration app enabling technicians to access real-time data and perform calibrations remotely. (Global Growth Insights, 2025)
- A sterile injectables manufacturer reported zero FDA 483 citations in three consecutive inspections after implementing digital calibration tracking – down from two citations per year under their paper-based system. (oxmaint.com, 2026)
- IoT-enabled calibration software usage rose 20% in 2024, connecting instruments directly to calibration management platforms for automatic scheduling, status tracking, and environmental condition monitoring. (Global Growth Insights, 2025)
10. Calibration Workforce and Future Outlook Statistics
- The Bureau of Labor Statistics projects 5% employment growth for calibration technologists from 2024 to 2034, reflecting rising demand driven by stricter quality standards and expanding regulated industries. (Bureau of Labor Statistics, 2025)
- With over 259 million registered passenger cars in 2024 (a 5.9% increase since 2019) and 255+ automotive plants across Europe, automotive manufacturing remains one of the largest calibration services demand drivers. (Persistence Market Research, 2025)
- The global calibration services market – covering physical calibration work rather than software – is expected to grow from $6.8 billion in 2026 to $10.1 billion by 2033, a 5.7% CAGR. (Persistence Market Research, 2025)
- The calibration management software market compound annual growth rate of 6.39% through 2033 significantly outpaces general quality management software growth, reflecting the sector’s regulatory compliance urgency. (Global Growth Insights, 2025)
Key Takeaways for Safety Managers and Quality Compliance Teams
Sources
Government and Regulatory
- ISO 9001:2015 Clause 7.1.5 – Monitoring and Measuring Resources: traceability, interval, and OOT requirements
- ISO/IEC 17025:2017 – Calibration laboratory competence, measurement uncertainty, and traceability requirements
- FDA 21 CFR Part 211.68 – Automatic, mechanical, and electronic equipment calibration requirements in pharmaceutical manufacturing
- Bureau of Labor Statistics – Calibration Technologists and Technicians: 5% projected employment growth 2024-2034
Industry and Research Sources
- Global Growth Insights (2025) – Calibration Management Software Market: $431M valuation, cloud adoption rates, sector adoption statistics
- Persistence Market Research (2025) – Global Calibration Services Market: $6.8B to $10.1B projection, 5.7% CAGR
- SNS Insider (2025) – Calibration Services Market: 48M+ active instruments, U.S. market projection
- SIMCO (2025) – Out-of-Tolerance in regulated calibration: reverse traceability and look-back requirements under ISO 9001 and AS9100
- GXP Ready (2026) – Why calibration programs fail GMP audits: common OOT investigation gaps and documentation failures
- oxmaint.com (2026) – Pharma calibration audit checklist: FDA and EU GMP requirements, 24-hour OOT response standard
- STS Calibration (2026) – ISO calibration requirements: five universal requirements across ISO 9001, ISO/IEC 17025, AS9100, FDA 21 CFR
- Calibration Awareness (2026) – ISO 9001 calibration clauses explained: Clause 7.1.5.2 scope, in-house calibration conditions, interval flexibility
- F7i.ai (2025) – Equipment Calibration Strategic Guide: data-driven interval setting and measurement uncertainty in operational context