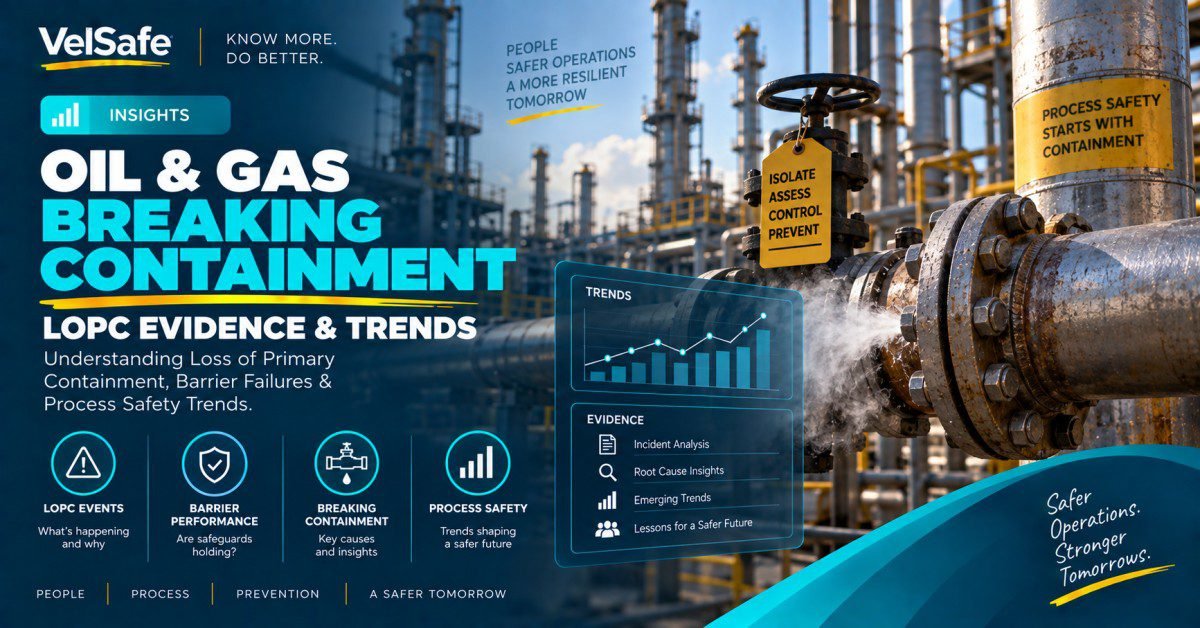
Insights: Oil and Gas Breaking Containment
Breaking containment in oil and gas operations is not a random event. The evidence shows it follows predictable patterns, concentrates in identifiable failure modes, and continues despite decades of regulatory pressure and industry investment in prevention.
Loss of primary containment (LOPC) is the unplanned or uncontrolled release of any material from primary containment, and it is the defining process safety event in oil and gas operations. Every major catastrophic incident in the industry traces back to a containment failure: wells that blow out, pipelines that rupture, vessels that fail, tanks that overflow. What the data from BSEE, PHMSA, OSHA, and IOGP shows is that LOPC in oil and gas does not follow a simple downward trend as the industry has grown and improved. The picture is considerably more complicated and more instructive for safety leaders who need to understand where the risk actually concentrates.
Insight Summary
Key findings from the evidence
1
From 2004 to 2023, PHMSA recorded 1,187 significant incidents involving crude oil pipeline spills, releasing a total of 750,000 barrels into the environment. That is an average of nearly 60 significant crude oil spill incidents per year across the U.S. pipeline network, for two decades.
2
BSEE data for 2023 shows the rate of loss of well control (LOWC) incidents on the Outer Continental Shelf has remained elevated since 2021 following a multi-year decline, signaling that the performance gains of the post-Macondo era have not been sustained.
3
OSHA’s 2024 updated PSM enforcement guidance identifies mechanical integrity as the element generating approximately 40% of all PSM violations in petroleum facilities, meaning the most common root cause of process safety non-compliance is equipment failure that was predictable, inspectable, and preventable.
4
A 2024 CDC/NIOSH analysis found 2,101 severe work-related injuries in the oil and gas extraction industry across 32 OSHA jurisdictions from January 2015 through July 2022, a rate consistently higher than comparable industrial sectors, with contract workers disproportionately affected.
5
The petroleum refining industry has had more fatal or catastrophic incidents related to the release of highly hazardous chemicals than any other sector since the PSM standard was promulgated in 1992, according to OSHA’s own process safety management documentation.
Key Insight
The oil and gas industry has improved its per-unit spill rate as production scaled dramatically, but the absolute frequency of significant containment failures has not fallen to a level that reflects the scale of that improvement. The dominant root cause remains mechanical integrity failure, which is inspectable, predictable, and preventable with the programme infrastructure that most large operators already have in place.
This is a programme execution gap, not a knowledge gap. The controls exist. The question for safety leaders is whether they are being applied with the consistency and rigour that the risk level demands.
What the Data Shows: Oil and Gas Breaking Containment by the Numbers
Understanding containment failure in oil and gas requires looking at three distinct operational environments: onshore and offshore upstream operations, midstream pipeline systems, and downstream refining and processing. Each has its own regulatory regime, its own incident reporting system, and its own dominant failure patterns. The data from each tells a consistent story with important differences in emphasis.
1,187
Significant Crude Oil Pipeline Spill Incidents (2004-2023)
750,000 total barrels released. Source: PHMSA via Frontier Group analysis (2024)
2,101
Severe Injuries in Oil and Gas Extraction (2015-July 2022)
Amputations, loss of eye, or inpatient hospitalization. Source: CDC/NIOSH MMWR (2024)
~40%
PSM Violations From Mechanical Integrity Failures at Petroleum Facilities
Largest single category of PSM citations. Source: OSHA PSM enforcement data (2024-2025)
Offshore: The LOWC Rate Reversal
The 2010 Deepwater Horizon blowout was the event that reset offshore safety expectations. In the years that followed, offshore operators, BSEE, and the industry’s own safety bodies invested heavily in blowout prevention technology, well integrity programmes, and the SEMS regulatory framework. The data showed genuine improvement through much of the 2010s.
What the BSEE 2023 performance data shows is more complicated. The rate of loss of well control (LOWC) incidents, which BSEE defines broadly to include any uncontrolled flow from a well and which was formerly tracked as the “blowout rate,” increased starting in 2021 and remained elevated through 2023. BSEE notes that none of the recent LOWC incidents resulted in oil released to the environment, which is meaningful progress in consequence severity. But the frequency reversal itself is the important signal: it suggests that the post-Macondo improvements in well control culture and equipment may have plateaued or eroded, rather than continuing to compound.
The more important finding in the 2023 data may be the fire incident rate. The rise in fire incident rates that started in 2020 continued into 2023. BSEE acknowledges that part of this increase reflects a 2019 clarification that expanded the definition of a reportable fire to include evidence such as soot, charring, melting, and smell. But the sustained upward trend across multiple years suggests something more than a reporting artefact. Fires on offshore platforms are among the highest-consequence containment events: they indicate that hydrocarbons are reaching ignition sources, which is a barrier failure, not just an incident.
Pipeline: A Persistent and Measurable Failure Rate
From 2004 to 2023, there were 1,187 significant incidents involving spills of crude oil from pipelines, with a total of 750,000 barrels of oil spilled into the environment. That figure, drawn from PHMSA’s own incident data, is not a statistic about a particularly bad period or a single catastrophic event. It is the accumulated total of 20 years of reportable pipeline containment failures across the U.S. network.
The pattern matters here. PHMSA’s definition of a significant incident includes liquid releases of 50 barrels or more, releases causing $50,000 or more in total costs in 1984 dollars, and releases resulting in fire or explosion. These are not minor operational leaks. They are failures large enough that federal reporting is required, investigation follows, and the environmental and financial consequences are material. An average of nearly 60 such events per year, sustained across two decades, is a structural feature of U.S. oil pipeline operations, not an anomaly.
PHMSA statistics show an average of 11 deaths and 48 injuries caused by 26 pipeline incidents annually across all U.S. pipeline systems from 2014 through 2024. For safety leaders, the implication of this figure is that pipeline incidents are not primarily a casualty event but an environmental and financial one. The injury and fatality numbers are low relative to incident volume. The containment failure is the primary consequence, and it happens in the presence of a workforce that typically is not in the immediate release area. The occupational hazard from pipeline LOPC falls heavily on the response side, on the workers who arrive after the release to contain, investigate, and remediate.
Downstream: The PSM Mechanical Integrity Problem
Since the promulgation of the Process Safety Management standard in 1992, the petroleum refining industry has had more fatal or catastrophic incidents related to the release of highly hazardous chemicals than any other sector. That is OSHA’s own characterisation of the downstream segment’s process safety performance, and it is a statement made not as a historical curiosity but as the rationale for maintaining an active National Emphasis Program specifically targeting petroleum refineries.
The updated PSM enforcement guidance issued by OSHA in January 2024 reflects where the citations continue to concentrate. Mechanical integrity violations account for approximately 40% of all PSM citations issued, making it the single largest category of process safety non-compliance. The most common findings within that category are consistent: missing or overdue equipment inspections, undocumented quality assurance for maintenance materials, and lack of written procedures for critical equipment categories. These are not sophisticated technical failures. They are programme execution gaps in basic inspection and maintenance management.
What Is Driving the Pattern: Three Root Cause Clusters
Root Cause 1: Mechanical Integrity Programmes That Are Designed but Not Executed
The most important insight from the PSM citation data is that mechanical integrity failures are not primarily a knowledge problem. Every major oil and gas operator has a mechanical integrity programme. The citations show that the problem is execution: inspections that are scheduled but not completed, repairs that are identified but deferred, quality assurance for maintenance materials that is specified in the programme but not documented in practice. This pattern is confirmed by OSHA’s finding that missing or overdue equipment inspections are the most common finding within the mechanical integrity citation category.
What this suggests is that the gap is at the management system level: the programme exists on paper, but the systems for tracking completion, escalating deferrals, and verifying that inspections are actually happening at the required intervals are not functioning. For safety leaders, this means that the highest-value intervention is not more training or better programme design. It is better programme execution management, with real-time tracking of inspection completion rates and hard escalation triggers when intervals are overdue.
Root Cause 2: The Contract Worker Exposure Problem
The 2024 CDC/NIOSH analysis found that oil and gas extraction contract workers incur more work-related severe injuries compared with workers in other industries. This is not a new finding, but its persistence across the 2015-2022 period of the study despite industry-wide safety initiatives targeting contractor management is significant. Contract workers are disproportionately exposed to the work environments closest to the containment boundary: well servicing, pipeline maintenance, tank inspection, and equipment maintenance are predominantly contractor activities in the industry’s current operating model.
The practical implication is that the contractor interface is where the occupational consequence of LOPC is most concentrated. When a containment failure occurs and someone is injured, it is most likely to be a contractor performing work at or near the containment barrier. Safety programmes that treat contractor management as a compliance function rather than a risk management function will continue to see this pattern in their injury data.
Root Cause 3: Corrosion and Material Fatigue as Chronic Pipeline Failure Modes
PHMSA’s pipeline incident data identifies corrosion and material defects as consistently among the top causes of significant pipeline spills. The 2022 Keystone pipeline spill, which released approximately 600,000 gallons of crude oil into a Kansas creek, was attributed to bulging stress from constant fatigue at a girth weld, a failure mode that the investigation found had been developing over the operational life of the pipeline. The pipeline had never been operated above 72% of its specified limited yield strength, meaning it failed within its design parameters because of accumulated fatigue rather than overuse.
The broader pattern is that a significant fraction of pipeline LOPC events are not failures of new infrastructure or failures under unusual operating conditions. They are failures of aging infrastructure under normal conditions, where corrosion, fatigue, and weld degradation progress faster than inspection cycles detect them. The U.S. pipeline network includes infrastructure that has been operational for decades, and the inspection intervals established at commissioning may not reflect the actual degradation rate of specific pipeline segments operating in aggressive environments.
What This Means for Safety Leaders: Five Implications
The offshore LOWC rate reversal deserves a programme review response, not a wait-and-see one
When BSEE data shows a multi-year increase in loss of well control incidents after a period of improvement, safety managers at offshore operators should treat it as a signal that post-Macondo improvements are not self-sustaining. Blowout prevention capability, well integrity management, and critical barrier verification require active management. If the rate is rising across the industry while your programme metrics show no change, that is not reassurance. It is a data conflict that needs investigation.
Mechanical integrity is the highest-return process safety investment for most downstream operators
When 40% of PSM violations concentrate in a single element, and when that element’s most common deficiency is overdue inspections rather than missing knowledge, the priority is clear. Investment in systems that track inspection completion in real time, escalate deferrals automatically, and make the current inspection status of every critical piece of equipment visible to safety leadership will return more process safety performance per dollar than any other programme enhancement for most downstream oil and gas facilities.
Pipeline integrity programmes need risk-ranked inspection intervals, not uniform ones
The Keystone failure pattern, where a pipeline failed within design parameters because of accumulated fatigue that standard inspection intervals missed, is a warning about the adequacy of uniform inspection programmes for heterogeneous infrastructure. Segments operating in high-consequence areas, high-stress environments, or with a history of anomaly findings need shorter inspection cycles. Segments that have shown no degradation over multiple inspection cycles can support longer ones. A risk-ranked inspection approach is both more protective and more efficient than a uniform-interval one.
Contractor integration into safety management systems is a risk management requirement, not a compliance formality
The CDC/NIOSH finding that contract workers bear a disproportionate injury burden in oil and gas extraction points to a systemic gap in how contractors are integrated into site safety management. Pre-qualification, orientation, and JSA participation are necessary but not sufficient. Contractors performing work at the containment boundary need the same quality of supervision, barrier verification, and stop-work authority as direct employees. Safety programmes that treat the contractor interface as paperwork compliance will continue to see the injury pattern the data shows.
The aggregate LOPC rate is not improving proportionally to the scale of industry investment in prevention
This is the most important implication of the data for senior safety leaders. U.S. oil production scaled from approximately 5.5 million barrels per day in 2008 to over 13 million in 2023, more than doubling. The per-unit spill rate has improved. But 60 significant pipeline spill incidents per year, sustained across two decades, combined with an elevated offshore LOWC rate and the highest PSM citation rate in any industry sector, suggests that the safety investment is not translating into a step-change reduction in absolute containment failure frequency. The question safety leaders should be asking is not “are we improving?” but “are we improving fast enough, and in the right places?”
Practical Implications: Where to Focus Programme Attention
Programme Area
Evidence-Based Priority Action
Mechanical Integrity (Downstream)
Implement real-time inspection completion tracking. Establish hard escalation triggers for overdue intervals. Review every inspection deferral for risk justification.
Audit barrier verification practices for critical well control equipment. Confirm blowout preventer testing intervals are being met. Review LOWC incident reporting culture.
Pipeline Integrity (Midstream)
Apply risk-ranked inspection intervals. Prioritise segments in high-consequence areas and those with anomaly history. Investigate corrosion and fatigue findings from ILI runs within 90 days.
Contractor Safety Management
Extend barrier verification requirements to contractors at the containment boundary. Track contractor injury rates separately. Include contractor stop-work authority in pre-task briefings.
Track Tier 1 and Tier 2 PSEs per IOGP Report 456 and API RP 754. A rising Tier 2 rate is a leading indicator for Tier 1 events. Report both to leadership monthly.
Sources: BSEE Offshore Incident Statistics | PHMSA Pipeline Performance Measures | OSHA PSM
Executive Takeaway
For safety and operations leadership in oil and gas
01
Treat mechanical integrity as your highest-return process safety investment. The citation data is unambiguous: 40% of PSM violations trace here, the most common finding is an overdue inspection, and the consequence of a missed interval is a containment failure that was predictable.
02
Investigate any upward movement in your LOWC or fire incident rates immediately. These are not fluctuations to monitor over time. They are signals that a barrier has been compromised or that the frequency of near-miss events is rising ahead of a more serious outcome.
03
Apply risk-ranked inspection to your pipeline portfolio. Uniform inspection intervals are administratively simple but risk-blind. Segments with anomaly history, aggressive environment exposure, or proximity to high-consequence areas need more frequent assessment, not the same interval as a clean, low-stress segment.
04
Reframe contractor management as containment risk management. The contractors at your containment boundary are the workers most likely to be injured in an LOPC event. Integrating them into your barrier verification and stop-work authority programmes is not an administrative expansion. It is the risk control that the injury data shows is missing.
05
Track Tier 1 and Tier 2 process safety events and report both to leadership. Tier 2 events are the leading indicator for Tier 1. An organisation that only tracks and reports Tier 1 LOPC events is watching the lagging indicator and missing the signal that precedes it by months.
Frequently Asked Questions
What is loss of primary containment (LOPC) in oil and gas?
Loss of primary containment is the unplanned or uncontrolled release of any material from the primary containment system. In oil and gas, the primary containment includes wellbores and blowout preventers, pipelines and associated equipment, production vessels and separators, storage tanks, and processing equipment at refineries and gas plants. An LOPC event can range in severity from a small leak from a flange that is immediately contained to a catastrophic well blowout or major pipeline rupture. The oil and gas industry tracks LOPC using the API RP 754 and IOGP Report 456 process safety event (PSE) framework, which classifies events into Tier 1 (greater consequence) and Tier 2 (lower consequence) categories based on the quantity and type of material released.
What does BSEE regulate in terms of oil and gas containment?
The Bureau of Safety and Environmental Enforcement (BSEE) regulates offshore oil and gas operations on the U.S. Outer Continental Shelf under 30 CFR Parts 250 and 254. BSEE’s jurisdiction covers well integrity, blowout prevention, production safety systems, oil spill response planning, and the Safety and Environmental Management System (SEMS) framework. Offshore operators are required under 30 CFR 250.188 to immediately report to BSEE any fatality, injury requiring evacuation, loss of well control, fire, explosion, or oil spill event. BSEE publishes annual offshore incident statistics and investigates significant incidents through formal panel investigations. Source: BSEE: Offshore Incident Investigations
What is a significant pipeline incident under PHMSA rules?
PHMSA defines a significant incident as one involving any of the following: a fatality or injury requiring in-patient hospitalization; total costs of $50,000 or more measured in 1984 dollars; highly volatile liquid releases of 5 barrels or more or other liquid releases of 50 barrels or more; or liquid releases resulting in an unintentional fire or explosion. Pipeline operators subject to 49 CFR Parts 192 and 195 are required to report incidents meeting these thresholds within 30 days. PHMSA maintains a publicly accessible incident database going back decades that allows operators, researchers, and regulators to analyse trends by system type, cause, operator, and geography. Source: PHMSA: Pipeline Incident Flagged Files
What does the PSM standard require for oil and gas process facilities?
OSHA’s Process Safety Management standard at 29 CFR 1910.119 applies to facilities handling highly hazardous chemicals above threshold quantities. For oil and gas operations, this typically covers petroleum refineries, natural gas processing plants, and facilities using threshold quantities of flammable liquids or gases. The standard requires 14 elements including process safety information, process hazard analysis, operating procedures, training, contractor management, mechanical integrity, hot work permits, management of change, incident investigation, emergency planning and response, compliance audits, and trade secrets. OSHA updated its PSM enforcement guidance in January 2024, replacing a 1994 directive and signalling continued aggressive enforcement activity in petroleum facilities. Source: OSHA: Process Safety Management
What are Tier 1 and Tier 2 process safety events in oil and gas?
Tier 1 and Tier 2 process safety events (PSEs) are the industry-standard classification for loss of primary containment events under API RP 754 and IOGP Report 456. Tier 1 events have greater consequences, typically involving larger releases, ignition events, injuries, or regulatory reporting thresholds. Tier 2 events involve smaller releases that still represent a failure of the containment barrier but with lower immediate consequence. Both tiers are lagging indicators of process safety performance. The value of tracking Tier 2 separately from Tier 1 is that Tier 2 events occur more frequently and provide an earlier signal that containment barriers are degrading. A rising Tier 2 rate is a leading indicator for Tier 1 events and should trigger programme review before a higher-consequence event occurs. The IOGP publishes annual aggregated Tier 1 and Tier 2 PSE data from member companies as a benchmarking resource.
Why are oil and gas contract workers at higher injury risk during LOPC events?
Contract workers perform a disproportionate share of the work performed at or near the containment boundary in oil and gas operations: well servicing, equipment maintenance, tank inspection, pipeline inspection and repair, and turnaround maintenance at refineries are predominantly contract activities. When a containment failure occurs, the workers closest to the boundary are most exposed to the release and its consequences. The CDC/NIOSH finding that contract workers in oil and gas extraction incur more severe injuries than workers in comparable industries reflects this structural exposure pattern. It also reflects a secondary factor: contractor workers may receive less site-specific safety training, may have shorter-term relationships with site supervision, and may have less access to the informal safety culture that reduces risk-taking in direct-employment settings.
What has changed in OSHA’s PSM enforcement approach since 2024?
OSHA issued a new PSM enforcement guidance document in January 2024, replacing the 1994 compliance directive that had governed PSM inspection and citation practice for three decades. The new guidance reflects the agency’s updated understanding of where non-compliance concentrates and what inspection approaches best detect it. The updated document emphasises mechanical integrity programmes, contractor management, and incident investigation quality as the three areas where PSM citations have been most persistent. In late 2025, OSHA released a new PSM National Emphasis Program signalling more aggressive inspection targeting for refineries, ammonia refrigeration facilities, and chemical distributors. These regulatory developments mean that oil and gas facilities under PSM coverage should expect more frequent, more focused inspection activity in the areas where the data shows the most persistent non-compliance. Source: OSHA: PSM Standards and Directives
Sources
Government and Regulatory Sources
- BSEE: Offshore Incident Statistics (2024): source for offshore incident data including LOWC rates, fire incident rates, spill counts, and fatalities from 2010 through 2024 calendar year data.
- BSEE: Calendar Year 2023 Performance Charts (2024): source for the 2023 LOWC rate increase and sustained elevated fire incident rate data cited in the offshore analysis section.
- PHMSA: National Pipeline Performance Measures: source for hazardous liquid pipeline significant incident definitions, 20-year trend data, and integrity management performance tracking.
- OSHA: Process Safety Management: source for the PSM standard requirements, National Emphasis Program information, and the characterisation of petroleum refining as the sector with the most fatal or catastrophic HHC incidents since 1992.
- Congressional Research Service: PHMSA and Pipeline Security (2025): source for the 2014-2024 average of 11 deaths, 48 injuries, and 26 pipeline incidents annually across all U.S. pipeline systems, and the 1,081 PHMSA enforcement actions from 2020-2024.
Research Sources
- CDC/NIOSH MMWR: Severe Work-Related Injuries in the Oil and Gas Extraction Industry, 2015-2022 (2024): peer-reviewed source for the 2,101 severe injury count and the finding that OGE contract workers incur higher severe injury rates than other industry workers.
- Frontier Group: Accidents Waiting to Happen: Oil Pipelines (2024): source for the 1,187 significant crude oil pipeline spill incidents and 750,000 total barrels released from 2004-2023, based on PHMSA incident data analysis.
Standards and Industry Sources
- IOGP Report 456: Safety Performance Indicators, Process Safety Events 2023 Data: source for the LOPC definition, Tier 1 and Tier 2 PSE framework, and IOGP member company process safety performance benchmarking data.
Related VelSafe Articles
Worker Safety
Oil and Gas Worker Safety: Hazards, Controls, and Rights
The frontline guide for oil and gas workers covering H2S, confined space, LOTO, fall protection, and stop-work authority: the controls that protect workers when primary containment fails and releases occur.
Insights
NIMS and HAZWOPER: 30+ Statistics on Workplace Emergency Coordination
The evidence on workplace emergency coordination performance: what the data shows about HAZWOPER programme effectiveness and NIMS integration in high-hazard industrial environments including oil and gas.
Law
Oil and Gas Bloodborne Pathogens: 29 CFR 1910.1030
How the OSHA Bloodborne Pathogens Standard applies to oil and gas operations: first aid providers, on-site medics, and emergency responders whose work brings them into contact with blood during containment events and traumatic injuries at oil and gas worksites.
Oil and Gas Process Safety Insights
Evidence-Based Analysis for Oil and Gas Safety and EHS Leaders
VelSafe Insights covers process safety, containment failure trends, regulatory enforcement data, and operational safety evidence for EHS managers, process safety engineers, and operations leadership in upstream, midstream, and downstream oil and gas.
Browse All Insights