

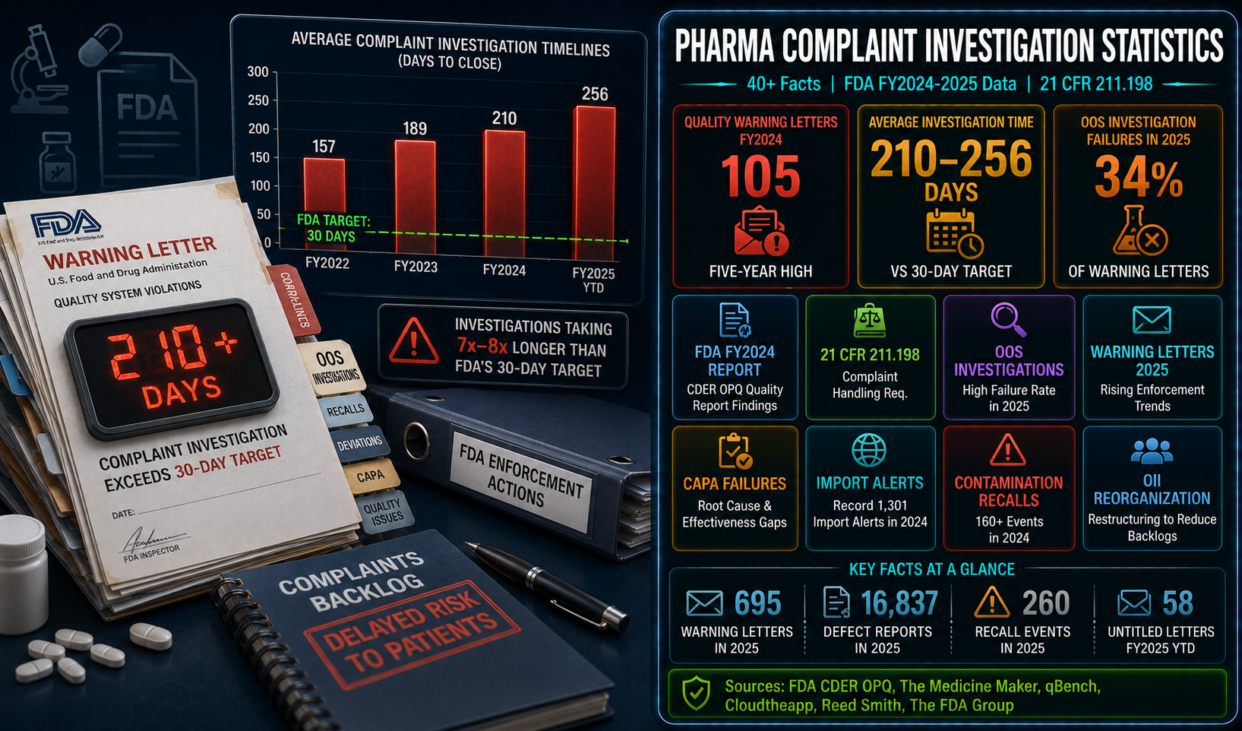
Complaint investigation failures are not a peripheral issue in pharmaceutical quality compliance. They are consistently among the most cited violations in FDA warning letters – appearing in enforcement actions against drug manufacturers, biologic facilities, API producers, medical device firms, and compounding pharmacies alike. Investigations that stall, close without adequate root cause analysis, or are never opened at all create the exact conditions that allow quality defects to progress into recalls, import alerts, and patient harm.
The enforcement data for 2024-2025 is unusually clear. FY2024 produced 105 drug-quality warning letters – a five-year high. FDA total warning letters in 2025 surged 73% in the second half of the year. Out-of-specification investigation failures were cited in 34% of all lab-directed letters. And the three violations that consistently top device enforcement lists – CAPA deficiencies, complaint handling failures, and supplier control gaps – remained unchanged through Q1 2026. Below we have compiled 40+ statistics on complaint investigation timelines, backlogs, enforcement trends, and regulatory requirements through 2025-26.
Editor's Choice: Key Pharma Complaint Investigation Statistics for 2025-26
1. FDA Requirements for Pharmaceutical Complaint Investigations: 21 CFR 211.198
- 21 CFR 211.198 requires written procedures for handling all complaints – written and oral – with mandatory review by the Quality Control unit for any complaint indicating possible failure to meet specifications. (eCFR 21 CFR 211.198)
- If a complaint investigation is not conducted, the regulation requires documentation of the reason and the name of the responsible person making that determination – a provision frequently cited in 483 observations when companies simply fail to acknowledge complaints at all. (21 CFR 211.198(b)(2))
- Complaint handling systems under 21 CFR 211.198 were cited in 142 Turbo EIR observations in 2012 alone, representing approximately 4% of all observations for drug companies – and medical device companies were cited 512 times for equivalent failures, nearly 11% of all observations. (ProPharma Group, citing 2012 FDA statistics)
- The most frequent cause of complaint handling observations is that systems do not exist for receiving, reviewing, or evaluating complaints, or that current procedures do not include adequate assessment provisions – a finding that has persisted from 2012 through 2025. (ProPharma Group; qBench, 2026)
- EU GMP Chapter 8 similarly mandates written SOPs for recording, evaluating, and investigating complaints about medicinal products. Marketing authorization holders must have formal complaint handling procedures covering both product quality and distribution complaints. (EU EudraLex Volume 4; IntuitionLabs, 2026)
2. Investigation Timeline Statistics: Target vs. Reality
- The industry best practice target for complaint investigation closure is 30 calendar days. FDA’s internal target for serious or priority cases involving injury is 15-30 days. But the gap between these targets and actual performance is striking. (Industry standard; FDA guidelines)
- The average time in investigation for pending FDA complaints between 2021 and 2023 was 210 to 256 days – approximately 7 to 8.5 months, nearly seven to eight times longer than the 30-day target. (FDA enforcement data)
- In the United Kingdom, the average time to process a pharmaceutical complaint almost tripled between 2004 and 2021 – from under 3 months to over 8.5 months, with some complaints now taking more than a year to resolve. (UK pharmaceutical industry data)
- Investigations involving third-party manufacturers or cross-border issues consistently take the longest – reflecting the coordination overhead of multi-site quality systems and the difficulty of obtaining samples, records, and root cause analysis from external partners. (FDA enforcement data; industry analysis)
- A practical example of the time cost: a product complaint investigation confirmed the absence of intended drug in a sample. Concurrent analysis of the same batch took approximately 18 months to confirm the manufactured product was acceptable – by which point the investigation had long exceeded any meaningful response window. (KENX complaint handling reference, citing 21 CFR 211.198)
3. FDA FY2024 Enforcement Data: Warning Letters, Recalls, and Postmarket Defect Reports
- 105 drug-quality-related warning letters were issued in FY2024, the highest in five years, reflecting intensified FDA scrutiny of pharmaceutical manufacturing quality systems including complaint handling and investigation adequacy. (The Medicine Maker, September 2025)
- FDA drug and biologics warning letters jumped further to 303 in FY2025 – a 59% increase from 190 in FY2024, following a brief enforcement pause in early 2025 and a subsequent 73% surge in letters issued from July through December 2025. (Cloudtheapp, June 2026; Reed Smith, December 2025)
- 16,837 postmarket quality defect reports were received by FDA in FY2024, including Field Alert Reports and Biological Product Deviation Reports – a slight decrease from FY2023 but representing the ongoing data pipeline that drives complaint investigations at manufacturing sites. (FDA FY2024 Quality Report)
- FY2024 saw 260 recall events, a 15% increase from FY2023, despite the number of individual products recalled (421) falling to a five-year low – suggesting more concentrated, multi-product recalls at fewer sites rather than a broader quality decline. (FDA FY2024 Quality Report; GMP-Publishing, 2025)
- Contamination was the top defect category driving FY2024 recalls, comprising microbial contamination (31%), sterility assurance issues (28%), foreign material/particulates (20%), product mix-up/cross-contamination (17%), and chemical contamination (4%). (FDA FY2024 Quality Report; CDER OPQ report)
- CGMP-related recalls represented 24% of FY2024 recalls – a sharp drop from approximately 50% in FY2020-FY2023 – suggesting that stability and specification failures, rather than systemic GMP breakdowns, increasingly drive recall decisions. (FDA FY2024 Quality Report)
4. Top Complaint and Investigation Violations in 2025 FDA Warning Letters
- Failure to investigate OOS results appeared in 50 of 148 lab-directed warning letters (34%) in 2025 – the top single citation category in pharmaceutical and medical device laboratory environments. (qBench analysis of 470 FDA warning letters, May 2026)
- In 2025, 13 lab warning letters specifically cited complaint handling failures – including laboratories that lacked formal complaint-handling procedures entirely or failed to investigate complaints that should have triggered a quality event. (qBench, May 2026)
- The FDA cited firms for inadequate quality control procedures under 21 CFR 211.22 in 36 letters in 2025, with Advanced Pharmaceutical Technology receiving a letter specifically noting that “your firm’s quality systems are inadequate.” (Leucine.io, November 2025)
- In a March 2025 warning letter, FDA cited Sanofi for failing to investigate critical deviations including bioreactor contamination events – noting that approximately 20% of bioreactor runs between January 2022 and July 2024 were rejected, and that “this rate is excessive and calls into question the state of control of your process.” (The Medicine Maker, March 2025)
- CAPA, complaint handling, and supplier controls – the same top three violation categories – appeared in 25 to 26 of the 54 device warning letters issued in 2025, confirming that these are structural compliance gaps rather than isolated failures. (Cloudtheapp, citing Covington and Burling analysis, June 2026)
- Device-specific quality system enforcement letters have surged from 6 in 2021 to 30 in 2025 – a 5x increase over five years – with the transition to QMSR (Quality Management System Regulation) changing inspection architecture without reducing the underlying violation patterns. (Cloudtheapp, June 2026)
5. Root Causes of Complaint Investigation Backlogs: What the Data Shows
- Warning letters rarely arrive as surprises. Behind almost every recent FDA warning letter sits the same pattern: incomplete investigations, weak documentation, late actions, outdated procedures, manual workarounds, or data that does not hold up under scrutiny. The 2024 and 2025 letters are not exceptions to this pattern – they are confirmations of it. (Scilife.io, April 2026)
- Companies with known, identified issues that were “quietly allowed to stall” are a documented pattern in FDA warning letters. One November 2025 warning letter documented open complaints and CAPAs at a device firm that had SOPs – the failure was not absence of systems but absence of follow-through on known issues. (The FDA Group, December 2025)
- Environmental excursions are a complaint investigation blind spot: many firms treat cleanroom excursions as facilities issues rather than product-risk events, failing to assess what was manufactured while conditions were out of spec. FDA’s November 2025 warning letter to a Saint Paul device manufacturer explicitly cited this failure pattern. (The FDA Group, December 2025)
- The CAPA closure gap is structural. In 19 of 148 lab-directed warning letters in 2025, FDA cited failures to initiate CAPA at all – or found that CAPA responses were inadequate, lacked documentation, or failed to address root causes. A corrective system that exists on paper but does not close the loop is a liability. (qBench, May 2026)
- Data integrity failures underlie many investigation backlogs. Unvalidated results, manual workarounds, and records that do not withstand audit scrutiny create delays at every stage of investigation – from triage to root cause confirmation to CAPA verification. (Leucine.io, November 2025)
6. Consequences of Inadequate Complaint Investigations: Recalls and Import Alerts
- 421 products were recalled in FY2024 – the lowest in five years – but with 260 recall events (a 15% increase from FY2023), indicating that individual recall events are affecting fewer products while the frequency of separate quality failures triggering recalls continues to rise. (FDA FY2024 Quality Report)
- 75 new import alerts were issued in FY2024, with 65% targeting OTC manufacturers. The largest percentage of additions were from sites in China (39%), India (13%), and Europe (13%) – reflecting the geographic concentration of pharmaceutical manufacturing and its quality risk. (FDA FY2024 Quality Report; GMP-Publishing, 2025)
- Contamination recalls in FY2024 break down as: microbial contamination (31%), sterility assurance issues (28%), foreign material and particulates (20%), product mix-up/cross-contamination (17%), and chemical contamination (4%). Each of these defect types should have been detected through complaint signals or batch release testing long before reaching recall stage. (FDA CDER OPQ report)
- Ophthalmic agents led all therapeutic classes in recall frequency in FY2024, followed by products flagged for stability failures including dissolution and impurity issues above specification limits. (The Medicine Maker, September 2025)
- The FDA’s FAERS adverse event reporting system has received over 22 million total adverse event reports since tracking began, with frequency increasing every year since 2012 – the postmarket surveillance data pool that complaint investigations must be cross-referenced against. (Lightfoot Law, 2024)
7. FDA Enforcement Posture in 2025-26: Inspections, Untitled Letters, and International Scrutiny
- Following a brief enforcement pause in early 2025, the FDA significantly accelerated warning letter issuance in the second half of the year, with 327 letters from July through December 2025 representing a 73% increase over the same period in 2024. (Reed Smith, December 2025)
- Untitled letters – formal notices for violations that include adulteration, misbranding, and objectionable conditions – jumped from just 5 in FY2024 to 58 in FY2025, indicating a broader base of initial enforcement action beyond formal warning letters. (Reed Smith, December 2025)
- The FDA’s ORA reorganization into the Office of Inspections and Investigations (OII) on October 1, 2024 was specifically designed to sharpen focus on inspections, investigations, and imports – a structural change that signals continued inspection intensity into 2025-26. (Pharmaceutical Online, March 2026)
- FDA now tracks 4,619 manufacturing sites worldwide in the CDER Site Catalog, with 41% in the U.S. The remaining 59% of global manufacturing sites – including major API production hubs in India and China – remain subject to FDA inspection authority and complaint handling requirements for U.S.-marketed products. (FDA FY2024 Quality Report)
- In Q1 2026, the same three violations – CAPA deficiencies, complaint handling failures, and supplier control gaps – remain the most cited in device enforcement letters, appearing in 25-26 of the 54 device letters issued in 2025. (Cloudtheapp, June 2026)
Key Takeaways for Pharmaceutical Quality and Compliance Teams
Sources
Government and Regulatory Sources
- FDA – 21 CFR 211.198 Complaint Files: written procedure, investigation, adverse event screening, and record-keeping requirements
- FDA – FY2024 Report on the State of Pharmaceutical Quality (CDER OPQ): 16,837 defect reports, 421 recalls, 260 events, 75 import alerts
Industry and Research Sources
- The Medicine Maker (September 2025) – FDA FY2024 Quality Enforcement Report: 105 quality warning letters (5-year high), contamination as top recall defect, 4,619 manufacturing sites
- qBench (May 2026) – Inside 470 FDA Warning Letters from 2025: 34% OOS investigation failures, 29% missing procedures, 13% CAPA inadequacy in 148 lab-directed letters
- Cloudtheapp (June 2026) – FDA Enforcement Trends Q1 2026: 695 total warning letters in 2025, 303 drug/biologics (+59%), CAPA/complaint/supplier top three device citations
- Reed Smith (December 2025) – FDA Inspections in 2025: 327 warning letters H2 2025 (+73%), 58 untitled letters (up from 5 in FY2024)
- The FDA Group (December 2025) – Warning letter breakdown: known issues quietly stalling, open complaints, CAPA gaps at device manufacturer
- Leucine.io (November 2025) – 2025 FDA Warning Letter Trends: environmental monitoring failures, 36 letters for inadequate quality procedures, international enforcement patterns
- Pharmaceutical Online (March 2026) – FY2025 Warning Letter Trends: ORA to OII reorganization October 2024, enforcement structure changes
- IntuitionLabs (June 2026) – Pharma Complaint Management: 21 CFR 211.198, EU GMP Chapter 8, CAPA requirements, cross-functional investigation responsibilities
- ProPharma Group – Four Key Parts to a Complete Complaint Handling Program: 142 drug 483 citations in 2012, most frequent failure modes
- GMP-Publishing (2025) – FDA 2024 State of Pharmaceutical Quality: import alerts, recall drivers, CGMP vs. contamination recall trends