

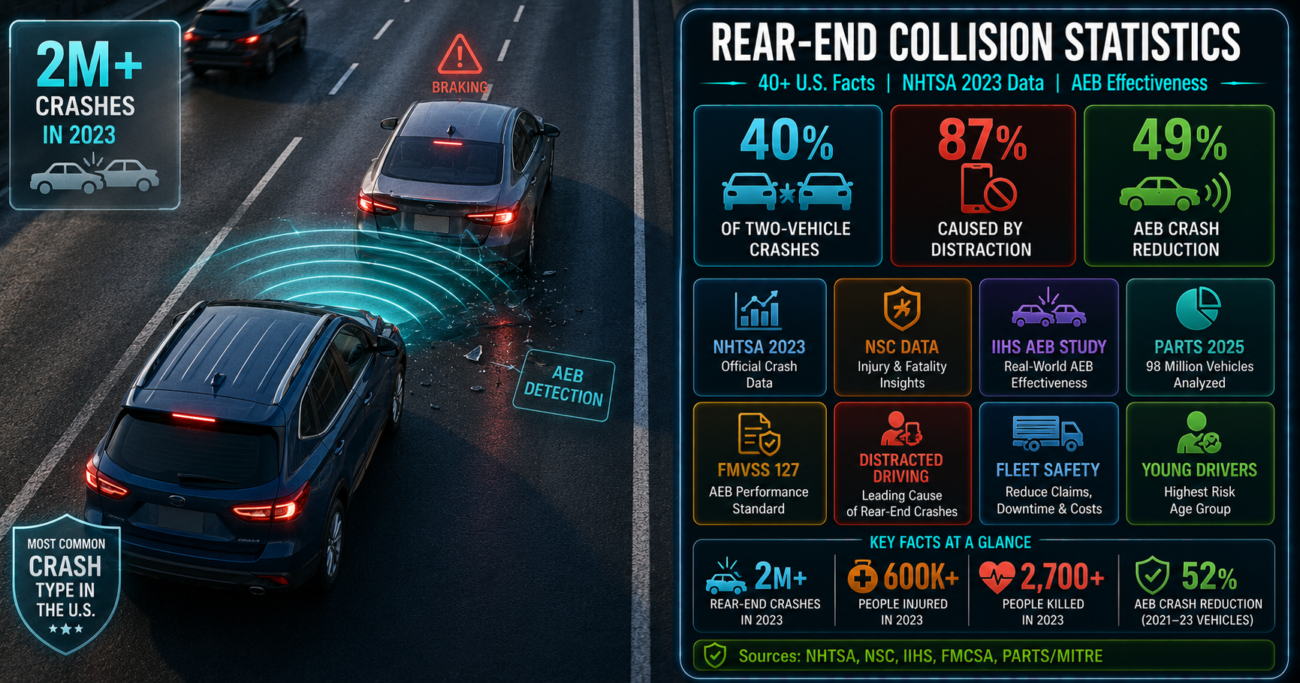
No other crash type happens more often. Rear-end collisions have held the top position in U.S. crash frequency data for decades – and they are increasing. Between 2011 and 2023, the total number of annual rear-end crashes grew from 1.7 million to over 2 million, with injuries rising from 475,000 to more than 600,000. Fatalities in rear-end crashes now exceed 2,700 per year. The causes are well understood: distracted driving accounts for the majority of incidents, with 87% of rear-end collisions attributed to some form of driver inattention.
The good news is that the data on prevention has improved significantly. A January 2025 study by the Partnership for Analytics Research in Traffic Safety – the largest ADAS effectiveness study ever conducted, covering 98 million vehicles – found that AEB reduces rear-end crashes by 49% overall, and by 52% in newer vehicles. NHTSA finalized a rule in 2024 requiring AEB on all passenger cars and light trucks by 2029. Below we have compiled 40+ statistics on rear-end collision frequency, severity, causes, high-risk groups, fleet impact, and technology effectiveness from NHTSA, NSC, IIHS, and FMCSA sources.
Editor's Choice: Key Rear-End Collision Statistics
1. Rear-End Collision Frequency Statistics
- Rear-end collisions are the most common type of crash in the U.S., accounting for approximately 40% of all two-vehicle crashes and 28.4% of all police-reported traffic crashes in 2022. (NHTSA, 2022; NSC, 2023)
- In 2023, there were more than 2 million rear-end crashes – an increase from approximately 1.7 million in 2011, reflecting a 17%+ rise over 12 years. (NSC Motor Vehicle Crash Data, 2023)
- Overall U.S. traffic crashes reached an estimated 6,138,359 police-reported incidents in 2023, an increase of 3.5% from 2022 – the broader context in which rear-end crash volume sits. (NHTSA Summary of Motor Vehicle Traffic Crashes, October 2025)
- Rear-end collisions accounted for 39% of all injury-producing multi-vehicle crashes in 2023 – a proportion that has remained consistent even as total crash volume grew. (NSC, 2023)
- The angle (T-bone) collision is the second most common crash type at approximately 22.7% of all crashes, compared to rear-end collisions at 28.4%, underscoring the dominance of rear-end incidents in the crash distribution. (NHTSA, August 2024)
2. Rear-End Collision Fatality and Injury Statistics
- In 2023, rear-end crashes resulted in more than 2,700 fatalities and over 600,000 injuries – compared to approximately 1,800 fatalities and 475,000 injuries in 2011, representing a 50% increase in fatal outcomes over 12 years. (NSC Motor Vehicle Crash Data, 2023)
- Rear-end crashes account for 18% of fatal two-vehicle crashes – a lower proportion than their 40% share of all two-vehicle crashes, reflecting that angle collisions and head-on impacts tend to be more lethal per incident. (NSC, 2023)
- Total U.S. traffic fatalities fell to 40,901 in 2023 – a 4.3% decrease from 42,721 in 2022 – while estimated injuries rose 2.5% to 2.44 million. Rear-end crashes contributed to both figures. (NHTSA Overview of Motor Vehicle Traffic Crashes In 2023, April 2025)
- NHTSA projects that its 2024 AEB mandate will save at least 360 lives per year and prevent at least 24,000 injuries annually once fully implemented – the majority of those prevented incidents being rear-end crashes. (NHTSA FMVSS No. 127, May 2024)
- Preliminary NHTSA estimates show 39,345 traffic fatalities in 2024 – a further 3.8% decline – marking the first time since 2020 that the figure fell below 40,000, with 11 consecutive quarterly decreases in fatality rates. (NHTSA Early Estimates, 2025)
3. Causes of Rear-End Collisions: Distraction, Speed, and Following Distance
- 87% of all rear-end collisions are attributed to distracted driving, making inattention the overwhelming primary cause – ahead of speeding, tailgating, and impairment. (NHTSA statistics)
- In 2023, there were 3,275 people killed and an estimated 324,819 people injured in motor vehicle crashes involving distracted drivers – across all crash types, not only rear-ends. (NHTSA Distracted Driving in 2023, April 2025)
- Distraction-affected crashes represented 8% of fatal crashes, 13% of injury crashes, and 13% of all police-reported crashes in 2023 – consistent with the prior year. (NHTSA, 2023)
- Cellphone use was recorded as a distraction in 369 fatal crashes in 2023 – 12% of all distraction-affected fatal crashes – though police crash reports are known to undercount electronic device involvement. (NHTSA Distracted Driving in 2023)
- The percentage of drivers manipulating hand-held electronic devices has increased 104% since 2015 – from 2.2% to 4.5% at any given daylight moment in 2024 – even as phone call use declined. (NSC, citing NHTSA NOPUS 2024)
- Over 20% of all rear-end crashes are caused specifically by tailgating – insufficient following distance that leaves no reaction time when the lead vehicle brakes unexpectedly. (NHTSA, August 2024)
4. Automatic Emergency Braking: Effectiveness Statistics for Rear-End Prevention
- The January 2025 PARTS study – the largest ADAS effectiveness study ever conducted, pairing 98 million vehicles with 21.2 million crash records across 16 states – found AEB reduces rear-end crashes by 49% overall. (PARTS / NHTSA / MITRE, January 2025)
- Newer AEB systems in 2021-2023 model year vehicles achieved a 52% reduction in rear-end crashes, compared to 46% in 2015-2017 vehicles – confirming that the technology continues to improve with each generation. (PARTS, 2025; WardsAuto, March 2025)
- NHTSA finalized Federal Motor Vehicle Safety Standard No. 127 in May 2024, requiring AEB as standard on all new passenger cars and light trucks by September 2029. The rule projects saving at least 360 lives and preventing 24,000 injuries per year. (NHTSA, May 2024)
- IIHS research found that AEB systems meeting voluntary manufacturer commitments would reduce rear-end crashes by 40% across the fleet – a figure that the PARTS 2025 data has since exceeded. (IIHS / NHTSA AEB commitment fact sheet)
- A 2025 IIHS study on red light cameras found that at current AEB adoption rates, rear-end crash increases associated with sudden stops at camera-equipped intersections narrow from 21% to 19% – and would fall to 14% if every vehicle had AEB. (IIHS, September 2025)
- Despite AEB effectiveness, pickup trucks – which pose greater injury risk due to vehicle weight – had AEB as standard on only 5% of registered models in 2021, compared to 18% of SUVs. (IIHS, 2022)
5. Rear-End Collisions and Commercial Fleets
- In 2021, at least one driver-related factor was recorded for 32% of large truck drivers involved in fatal crashes and 54% of bus drivers in fatal crashes – higher than the general driver population. (FMCSA, November 2023)
- Of 205 buses involved in fatal crashes in 2021, 17.1% sustained rear impacts – a meaningful category given the high occupancy exposure in bus crashes. (FMCSA, November 2023)
- For fleet safety managers, rear-end collisions are a priority intervention target because the primary causes – distraction, tailgating, and inadequate following distance – are directly addressable through driver behavior programs, telematics monitoring, and vehicle technology specification. (road safety consensus)
- IIHS pickup truck data showing 43% lower rear-end crash rates with AEB has direct fleet implications: organizations specifying light-duty trucks and vans should treat AEB as a mandatory procurement requirement, not an optional upgrade. (IIHS, 2022)
6. Young Drivers and Distraction: Higher-Risk Groups in Rear-End Crash Data
- Drivers aged 15-20 years had the largest proportion of distracted drivers involved in fatal crashes among all age groups in 2023 – a consistent finding across multiple NHTSA data years. (NHTSA Distracted Driving in 2023)
- In 2023, 7% of people killed in teen driving crashes (ages 15-19) were in crashes that involved a distracted teen driver – and teen drivers represented 8.9% of all drivers in fatal traffic crashes despite being only 5.1% of licensed drivers. (NHTSA 2023 Final File)
- The percentage of drivers manipulating hand-held electronic devices at any given moment increased 104% between 2015 and 2024 (from 2.2% to 4.5%), counteracting improvements in other distracted driving categories. (NSC / NHTSA NOPUS 2024)
- Conversely, the prevalence of drivers using hand-held cell phones for calls decreased from 3.8% in 2015 to 1.9% in 2024 – a 50% reduction likely reflecting increased hands-free technology adoption. (NSC / NHTSA NOPUS 2024)
- Overall distraction-affected fatal crashes have decreased nearly 9% since 2015, with 2024 showing a 2% decline from 2023 (3,208 deaths vs. 3,283) – suggesting that awareness and technology interventions are having some measurable effect. (NSC Injury Facts, May 2026)
7. Overall U.S. Traffic Safety Trends: The Context for Rear-End Statistics
- Total U.S. traffic fatalities fell to 40,901 in 2023 (a 4.3% decrease from 2022) and are estimated at 39,345 in 2024 – the first time below 40,000 since 2020 – following 11 consecutive quarterly declines. (NHTSA, 2025)
- Despite the recent downward trend, traffic fatality rates in the U.S. remain significantly higher than a decade ago and higher than peer nations, according to NHTSA Chief Counsel Peter Simshauser. (NHTSA press release, 2025)
- In 2023, one person was killed every 13 minutes and an estimated 5 people injured every minute in traffic crashes – figures that frame the scale of rear-end collisions within the broader road safety challenge. (NHTSA Summary of Motor Vehicle Traffic Crashes, October 2025)
- Young drivers accounted for 8.9% of all drivers in fatal crashes in 2023 despite being only 5.1% of licensed drivers – an overrepresentation ratio that reflects the combined risk factors of inexperience, distraction, and speeding. (NHTSA, October 2025)
Key Takeaways for Safety Managers and Fleet Professionals
Sources
Government and Regulatory Sources
- NHTSA – Summary of Motor Vehicle Traffic Crashes 2023 (DOT HS 813 762, October 2025): 6.1M crashes, fatality and injury totals
- NHTSA – Overview of Motor Vehicle Traffic Crashes in 2023 (DOT HS 813 705, April 2025): fatality rate per VMT, injury trends
- NHTSA – Distracted Driving in 2023 (DOT HS 813 703, April 2025): 3,275 fatalities, 324,819 injuries in distraction-affected crashes
- NHTSA – Early Estimates of Traffic Fatalities 2024: 39,345 projected fatalities, 3.8% decline from 2023
- NHTSA – FMVSS No. 127: AEB mandatory on all new passenger cars and light trucks by September 2029; projects 360 lives saved annually
- FMCSA – Large Truck and Bus Crash Facts 2021 (November 2023): driver-related factors, bus rear-impact crash data
Industry and Research Sources
- PARTS / MITRE (January 2025) – Largest AEB effectiveness study: 98M vehicles, 21.2M crashes, 49% rear-end crash reduction
- IIHS (September 2025) – AEB and red light cameras: rear-end crash increase mitigation at current vs. full AEB adoption rates
- National Safety Council Injury Facts (May 2026) – Distracted driving deaths 2023-2024; hand-held device use trends 2015-2024
- The Eagle (April 2026) – Rear-end crash trend 2011-2023: 2M+ crashes, 600,000+ injuries, 2,700+ fatalities (NSC / NHTSA data)
- WardsAuto (March 2025) – PARTS study detail: 52% reduction in 2021-2023 vehicles; 46% in 2015-2017 vehicles
- Driving-Tests.org (NHTSA August 2024 data) – Rear-end crashes at 28.4% of all crashes; tailgating in 20%+ of rear-ends