
FDA Form 483 data is one of the clearest windows available into where quality systems actually fail, not where companies say they are compliant, but where inspectors standing in manufacturing floors and quality offices found conditions that, in their judgment, may constitute violations of federal requirements.
FY2024 inspection data makes three things clear. First, inspection volume is up sharply: 989 inspections in FY2024, a 27% increase from 776 in FY2023, driven by the FDA clearing pandemic-era backlogs and intensifying foreign site oversight. Second, foreign sites now account for more than 62% of drug quality inspections, an all-time high, and enforcement against them has risen in proportion. Third, the finding categories at the top of the 483 list have not meaningfully changed in years. Quality Control Unit responsibilities has been the most-cited pharmaceutical observation for five consecutive years, according to IntuitionLabs’ analysis. The names of the top findings stay the same; the sites receiving them change.
This analysis examines what FY2024 483 and enforcement data reveals about the state of pharmaceutical and device quality systems, why the same categories persist despite years of regulatory pressure, and what the shifts in enforcement geography mean for global manufacturers.
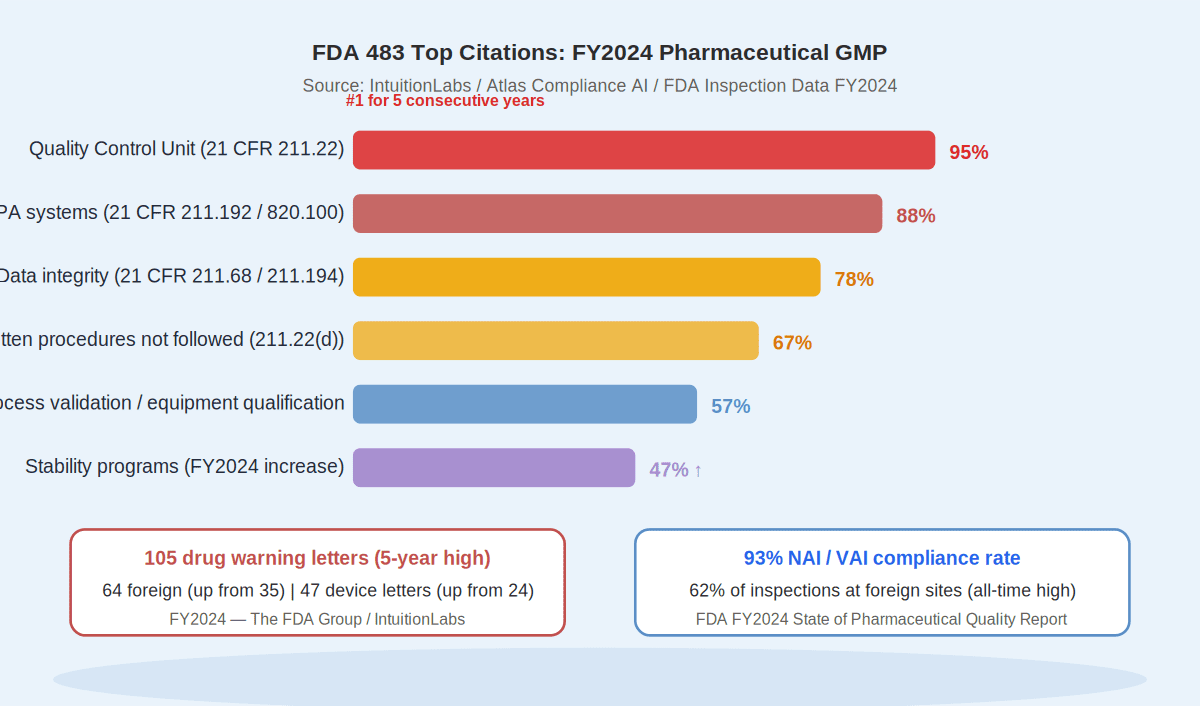
Quality Control Unit responsibilities (21 CFR 211.22) has been the single most-cited pharmaceutical GMP observation for five consecutive years. CAPA systems, data integrity, written procedures, and laboratory controls appear in the top tier of every annual FDA 483 dataset. The FY2024 pattern is consistent with prior years: CAPA remains the top observation across medical devices and is a leading pharmaceutical citation.
This persistence is not a coincidence, and it is not primarily explained by companies ignoring the requirements. Atlas Compliance AI’s analysis of FY2024 trends identifies the actual drivers as systemic: weak quality culture, production pressure over quality incentives, hybrid paper-electronic systems that create data gaps, under-resourced quality units, and insufficient executive oversight of remediation. The same root causes generate the same findings, inspected at different sites each year.
In medical devices, FY2024 saw a sharp enforcement surge: 47 device-related warning letters, up from 24 in FY2023. In pharmaceuticals, 105 warning letters for drug quality issues were issued, the highest five-year total, driven by a 71% increase in foreign letters (from 35 to 64).
The following categories appear consistently across FY2024 FDA 483 and warning letter data, drawing from multiple analyses including IntuitionLabs, Atlas Compliance AI, Pharmaceutical Online, and The FDA Group.
The five-year consecutive run of QCU responsibility as the top pharmaceutical citation is worth examining carefully. It means that across hundreds of inspections annually, FDA investigators are consistently finding that quality unit functions, oversight, independence, and written procedures are inadequate. This is not a finding about a single regulation or a single activity. It is a finding about governance: the quality function is not operating as the check on manufacturing operations that regulation requires it to be.
Several structural dynamics contribute to this. Quality units at many manufacturers, particularly mid-sized and contract manufacturing organizations, are chronically under-resourced relative to production volumes. The pressure to release product under commercial and supply chain constraints places the QCU in a position where independence is compromised in practice even when it exists on paper. A recent warning letter cited in Pharmaceutical Online identified the FDA explicitly noting the ineffectiveness of the executive management team in addressing quality system failures, signalling that FDA now traces QCU deficiencies upward to senior leadership accountability.
For CAPA, the mechanism of persistence is different. CAPA failures are both cause and symptom of a governance gap, as Atlas Compliance AI describes them. Companies that receive a CAPA observation, remediate it for the next inspection, and then allow the system to drift back to prior patterns are the firms that appear in repeat findings. The companies that achieve No Action Indicated (NAI) outcomes consistently are those that have embedded CAPA governance into routine operations rather than treating it as an inspection-preparation activity.
Data integrity findings follow a third pattern. ERA Sciences’ analysis of 2024 inspection observation data identifies four recurring integrity failure modes: poor or no attribution (generic shared accounts with no individual attribution), poor legibility (overwritten or altered records), questionable accuracy (unverified manual calculations), and transformation errors (spreadsheet or data system manipulations without version controls). Each of these is a systemic gap rather than an individual failure, and each requires a system-level fix.
Generic shared login accounts. Altered batch records. Audit trails disabled. Investigations closed as “human error” without root cause. CAPA actions defined but not implemented in controlled documents.
These are not isolated incidents. They are patterns that recur across sites and years.
Quality units with genuine authority and sufficient resources. CAPA systems that produce systemic changes, not paperwork closures. Data governed by design, not by audit fear. Executive visibility into quality metrics.
FDA’s FY2024 data: 93% of sites achieved NAI or VAI on their most recent inspection.
The most significant structural shift in FY2024 inspection data is geographic. Foreign inspections now account for over 62% of drug quality assurance inspections, the highest proportion ever recorded, according to FDA’s FY2024 State of Pharmaceutical Quality report. India and China together represent a substantial share: 34% of Indian and 28% of Chinese sites in the FDA Site Catalog underwent inspection during the fiscal year.
The enforcement consequences are real. China accounted for 39% of quality-related import alert additions in FY2024 despite representing only 17% of foreign sites. Of the 105 drug warning letters issued, 64 went to foreign sites, up from 35 in FY2023. The FDA also reached 198 Mutual Recognition Agreement partner inspections, the highest number to date, meaning European and other partner regulatory bodies conducted inspections that the FDA relied upon for its own enforcement decisions.
For manufacturers operating globally, the practical implication is that quality systems designed to satisfy domestic inspections are no longer sufficient if foreign operations or supply chains involve sites that operate to a different standard. IntuitionLabs’ analysis of FY2024 trends notes that 62% of FY2024 inspections were at foreign sites, and the sharp increase in foreign warning letters shows the FDA is acting on what those inspections find.
The companies that treat 483 observations as strategic signals, not administrative inconveniences, consistently avoid the escalation path from observation to warning letter to import alert.
Three trends from FY2024 are likely to intensify in the near term.
Foreign inspection intensity will continue rising. The FDA has signalled it intends to maintain or increase the pace of foreign site inspections, supported by growing MRA partner inspection capacity. The 198 MRA inspections in FY2024 were the highest on record, and that number is likely to increase as partnerships deepen. For manufacturers in India and China in particular, the historical assumption that foreign site inspection frequency would remain lower than domestic is no longer a reliable planning assumption.
AI-assisted inspection targeting and enforcement are beginning to affect which sites get inspected and when. IntuitionLabs’ February 2026 analysis notes that AI-powered tools are being integrated on both the FDA and industry sides, accelerating the shift toward predictive, risk-based compliance rather than reactive remediation. FDA’s risk-based site selection model already uses product risk, inspection history, and supply chain significance in prioritisation. That model will become more sophisticated.
The FDA’s positive feedback loop for thorough 483 responses (the Response Letter program) continues to expand. As the FY2024 data shows, 93% of inspected sites achieved satisfactory outcomes. The path to that outcome is not avoidance of inspections but consistency in quality system governance. The observation categories at the top of the 483 list will likely remain the same in FY2025; what will change is whether the sites receiving them are the same ones, or different ones.
Quality Control Unit responsibilities has been the most-cited pharmaceutical GMP observation for how many consecutive years as of FY2024?
Show answer
Five consecutive years (FY2020 through FY2024), according to IntuitionLabs’ analysis of FDA 483 data.
Sources
- IntuitionLabs, “FDA 483 Response: Best Practices and Compliance Guide”
- The FDA Group, “Inside FDA’s FY2024 Quality Report: What RA/QA Teams Need to Know”
- Atlas Compliance AI, “Top Deviation Trends in FDA 483s and Warning Letters”
- Pharmaceutical Online, “Trends in FDA FY2024 Inspection-Based Warning Letters”
- Pharmaceutical Online, “These Were FDA’s Top Citation Issues for Data Quality in 2024”
- Pharmaceutical Online, “2023-2024 Trends in FDA Form 483s for Pharmaceutical Formulation Facilities”
- Pharmaceutical Online, “2024 Trends in FDA Observations for Sterile Drug Manufacturers”
- VTI Life Sciences, “Current FDA 483s and Warning Letters Trends”
- ProPharma Group, “FDA Inspection Readiness: Top Observations and How to Avoid a Form 483”
- FDA, “Inspection Observations”
- Ioni.ai, “Top Compliance Issues in the Pharmaceutical Industry: FDA 483 Reasons and Examples”