

Safety orientation is often treated as an administrative checkpoint at the start of employment: sign the acknowledgement form, watch the video, collect the PPE. The data on what actually happens to workers who receive substantive safety orientation versus those who receive minimal or no orientation tells a different story about what the first week of employment determines.
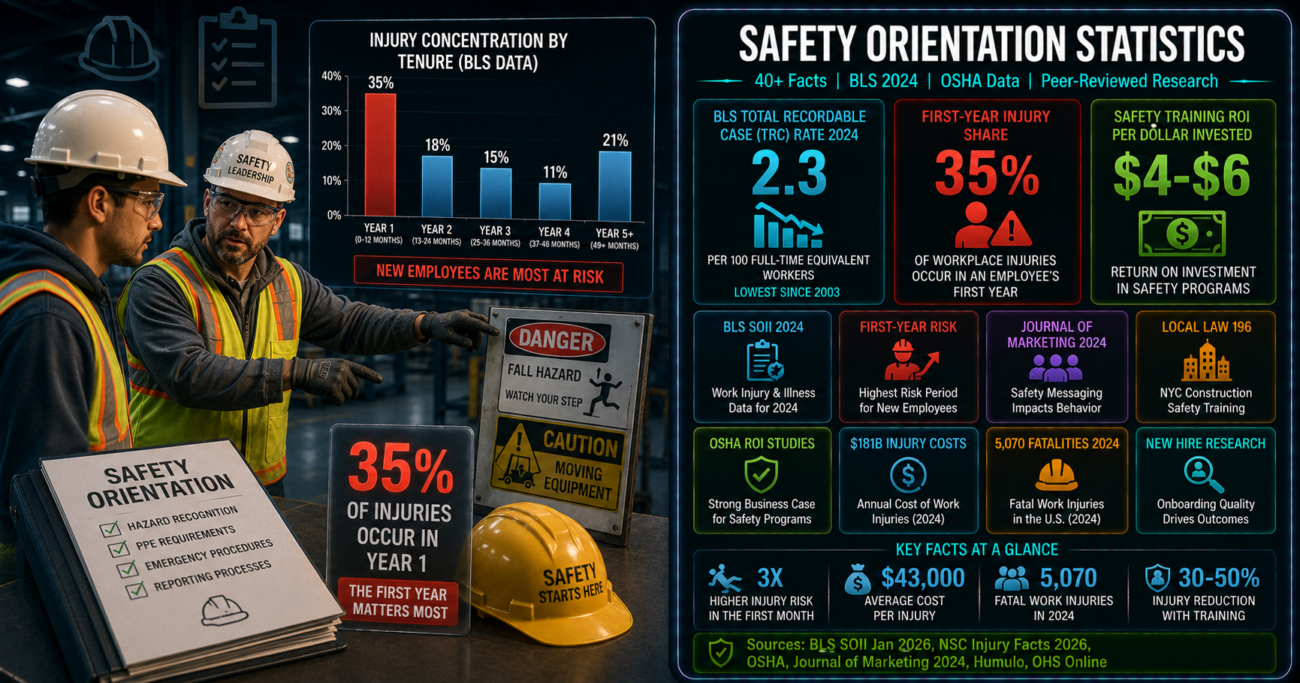
The most consequential period of a worker’s employment, from a safety standpoint, is the first year. Research consistently shows that workers in their first month are three times more likely to suffer a lost-time injury than those with over a year of experience. In construction, first-year workers account for 47% of injuries and 51% of workers’ compensation claims. And with total work injury costs reaching $181.4 billion in 2024, the financial stakes of that first-year risk are not abstract. This article examines what BLS, OSHA, and peer-reviewed research through 2025 show about how safety orientation affects injury rates – and what distinguishes programs that actually reduce them.
Editor's Choice: Key Safety Orientation and Injury Rate Statistics for 2024-25
1. National Injury and Fatality Data 2024: BLS and CFOI Figures
- Private industry employers reported 2.5 million nonfatal workplace injuries and illnesses in 2024 – down 3.1% from 2023 and the lowest total since BLS began tracking the data in 2003. The total recordable case rate fell to 2.3 per 100 FTE workers, down from 2.4 in 2023, also the lowest in the series. (BLS SOII, January 22, 2026, USDL-26-0101)
- The 2024 improvement was driven primarily by a 26% decline in illness cases to 148,000, particularly a 46.1% drop in respiratory illnesses to 54,000. The injury rate – separated from illnesses – held at 2.2 cases per 100 FTE workers, unchanged from 2023. Injury cases declined for the first time since 2020. (BLS SOII, January 22, 2026; NSC, January 2026)
- 5,070 fatal work injuries were recorded in 2024, down 4.0% from 5,283 in 2023. The fatal work injury rate was 3.3 per 100,000 FTE workers, down from 3.5. (BLS Census of Fatal Occupational Injuries, February 19, 2026)
- Despite the long-term downward trend – from 10.9 per 100 workers in 1972 to 2.3 in 2024 – the NSC explicitly noted that “injuries tell a different story” from the illness decline that drove overall improvement. The same injury types continue to cause the most serious harm, and the injury-only rate was unchanged. (NSC, January 30, 2026)
- OSHA released 2024 workplace injury and illness data from its Injury Tracking Application on April 17, 2025 – data from 370,000 Form 300A submissions and 732,000+ Form 300/301 records – representing the most granular employer-level injury and illness dataset available. (OSHA Trade Release, April 17, 2025)
- Sector variation remains significant: the agriculture, forestry, fishing, and hunting sector consistently reports rates more than twice the private industry average, and industry subsectors like construction, transportation, and health care continue to record rates well above the 2.3 national figure. (BLS SOII 2024; NSC Injury Facts 2026)
2. The First-Year Injury Concentration: The Most Actionable Data Point in Workplace Safety
- The Travelers Companies analyzed 1.5 million workers’ compensation claims over a five-year period and found that 35% of workplace injuries occur during an employee’s first year on the job. A separate 2024 analysis of OSHA case data placed the figure at 36%. In construction, first-year workers account for 47% of injuries and 51% of workers’ compensation claims. (Travelers Injury Impact Report; Humulo, March 2026)
- A study in the Journal of Occupational and Environmental Medicine found that workers in their first month are three times more likely to suffer a lost-time injury than those with over a year of experience. This is the strongest empirical statement of the first-month risk concentration and its direct relevance to orientation timing. (JOEM, cited in Humulo, March 2026)
- These are not statistical artefacts of new-hire population size. Research confirms the pattern holds across industries and age groups, meaning experienced workers moving to a new employer face the same first-year elevated risk as genuinely inexperienced workers. The variable that drives the risk is not tenure in general, but familiarity with the specific hazards of the specific workplace. (Travelers; OHS Online, November 2024)
- The OHS Online analysis (November 2024) notes that new workers are at heightened risk not only because they are unfamiliar with the environment but because they are “often reluctant to slow down or ask questions while they’re still proving themselves” – a social dynamic that compounds the information gap that orientation is designed to close. (OHS Online / Occupational Health and Safety, November 2024)
- The Harvard Business Review data cited in the OHS Online analysis found that early turnover rates can be influenced by as much as 50% based on how an employee is onboarded. A poor safety orientation is therefore both an injury risk and a turnover risk, with combined financial consequences that substantially exceed the orientation program cost. (OHS Online, November 2024)
3. Training Hours and Injury Outcomes: What the Peer-Reviewed Evidence Shows
- A 2024 peer-reviewed study in the Journal of Marketing (Sage Journals) analyzed site-level monthly data from a global oil field services company and found that a 10% increase in monthly safety training hours per capita led to a 6.45% to 9.57% decrease in monthly safety hazards per capita – 17.8 to 26.4 fewer hazard events per site per month. This is among the strongest causal estimates of training-dose effects published in recent peer-reviewed literature. (Chen, Sridhar, Han, Singh, Mittal, Im. Journal of Marketing, 2024)
- The study used unexpected catastrophic accidents as exogenous variation to identify the causal effect of training hours on safety outcomes – a methodology specifically designed to address the selection bias concern that safer companies invest more in training. The causal relationship between training volume and hazard reduction is confirmed even after controlling for this. (Sage Journals, 2024)
- OSHA training research (2025 meta-analysis) finds that training reduces injuries by 30-50% in programs with measurable outcomes, workers show 80%+ improvements in knowledge and protocol adherence after training, and companies with comprehensive safety training show approximately 50% lower injury rates versus those without structured programs. (OSHA Online Center, September 2025)
- New York City’s Local Law 196 – which mandated 40-hour site safety training for construction workers – provided real-world dose-response evidence: injury rates on covered construction sites declined more steeply than on comparable non-covered sites, establishing that hours of structured training, not just any training, drive the outcome difference. (Local Law 196 research, NYC)
- Conservative estimates from safety program ROI research suggest that well-implemented safety programs reduce recordable injuries by 20-40% in the first year, with sustained programs achieving 50-70% reductions over three years. The first-year reduction is particularly relevant because the first-year injury concentration means that early-tenure workers are the primary beneficiary. (SafetyPro Resources, November 2025)
4. The Economic Case: $181 Billion in Injury Costs and the $4-$6 Return
- The total cost of work-related injuries and illnesses in 2024 reached $181.4 billion, according to the National Safety Council – including $54.9 billion in wage and productivity losses alone. Liberty Mutual’s 2025 Workplace Safety Index found employers pay more than $1 billion per week in direct workers’ compensation costs for disabling non-fatal injuries. (NSC; OSHA Business Case; Liberty Mutual 2025 Workplace Safety Index)
- The average cost of a single medically consulted workplace injury rose to approximately $43,000 in 2024-25 – meaning a company that prevents two medically consulted injuries has more than covered the typical cost of a structured new-hire orientation program. (Techclass, May 2026)
- OSHA’s business case data, supported by U.S. DOE research, shows that proactive safety programs return $4 to $6 for every dollar invested. For training programs specifically, the return is realized through avoided medical bills, reduced insurance premiums, maintained productivity, and reduced turnover costs. (OSHA Business Case for Safety and Health; OSHA Online Center, 2025)
- Injury costs extend substantially beyond the direct medical cost. A single incident generates supervisor investigation time, replacement worker training, co-worker productivity loss, overtime costs, morale effects, and future insurance premium increases – costs that are typically 4-10x the direct medical cost in cost-accounting analyses. (Yourco.io, May 2026; OSHA $afety Pays calculator)
- Construction firms using OSHA’s CPWR SafeCalc ROI calculator find that a single lost-time injury in construction averages $35,000 in direct costs, excluding litigation, insurance premium increases, and long-term productivity losses. A single revenue-equivalent calculation shows that substantial sales revenue must be generated to offset a single serious injury – a figure that makes the orientation investment case straightforward. (SafetyPro Resources, November 2025)
- Organizations with documented safety management systems consistently report a positive impact on insurance terms: firms with safety programs commonly see their experience modification rate (EMR) fall below the industry average of 1.0, reducing workers’ compensation premiums by 10-25% or more independently of the direct injury cost avoidance. (Winter-Dent, November 2025)
5. What Effective Safety Orientation Programs Do Differently
- The research literature identifies four characteristics consistently associated with reduced first-year injury rates: (1) site-specific and role-specific hazard content, not generic industry content; (2) adequate duration – 4+ hours on day one for high-hazard environments; (3) hands-on verification of knowledge, not just signature acknowledgement; and (4) structured follow-up beyond the initial orientation date. (Humulo, March 2026; Safety Evolution, April 2026)
- 29 CFR 1926.21(b)(2) – the construction-specific OSHA training standard – requires employers to instruct each employee to recognize and avoid unsafe conditions and to know the regulations applicable to their work environment. An orientation program that does not cover the specific hazards of the worker’s role does not satisfy this requirement, regardless of how long it takes or how many signatures it generates. (Safety Evolution, April 2026; OSHA 1926.21)
- The signed acknowledgement form problem: a signed form proves only that the employee was present, not that they understood anything. OSHA inspectors routinely ask workers to demonstrate knowledge of emergency procedures, hazard controls, and PPE requirements. A form-based orientation system that does not verify knowledge provides no protection in enforcement proceedings. (Safety Evolution, April 2026)
- MEM Insurance’s 2026 guidance specifically notes that new employees are often reluctant to ask questions while proving themselves – making the buddy system particularly important for knowledge transfer beyond what is formally covered in orientation. An experienced worker walking alongside a new hire provides real-time hazard identification that no classroom session replicates. (MEM Insurance, March 2026)
- For safety orientation timing: OSHA’s 29 CFR 1910.38 requires emergency procedure information to be communicated at initial assignment. This is the regulatory floor, not the program standard. Effective programs treat day one as the highest-priority training delivery date, not an administrative formality before “real” work begins. (Humulo, March 2026; OSHA 1910.38)
6. What the Data Does Not Tell Us: Methodological Limits for Program Design
- The 35% first-year injury figure is a population-level correlation, not a program-level causal estimate. It establishes that the first year is the highest-risk period, which justifies prioritizing orientation at that stage. It does not establish how much of that risk is reducible through orientation specifically, as opposed to other interventions. (original article methodology section)
- NSC Injury Facts (2026) explicitly cautions that BLS incidence rates are “best viewed as more generic indicators – more of a moment in time – that are not necessarily indicative of future performance and can potentially be over-interpreted as reflections of organizational performance, intent and direction.” They are benchmarks, not program scorecards. (NSC Injury Facts 2026; Injury Facts NSC)
- The causality challenge in training research is well-documented: organizations that invest more in training are also more likely to have better supervision, equipment maintenance, and safety culture generally. The 2024 Journal of Marketing study’s use of exogenous variation is specifically intended to address this – making it more credible than observational training-outcome correlations. (Chen et al., 2024)
- For safety managers applying population-level findings to local programs: the appropriate benchmark is your own year-over-year trend within your sector, not the national private industry aggregate. BLS provides industry-specific NAICS-level rates that are the correct comparison for program evaluation. (BLS SOII 2024; NSC Injury Facts 2026)
7. OSHA Training Requirements for Safety Orientation: The Regulatory Baseline in 2025
- OSHA’s construction training standard 29 CFR 1926.21(b)(2) requires employers to instruct each employee to recognize and avoid unsafe conditions and to know the applicable regulations for their work environment. This is not a general awareness requirement – it is a site-specific and hazard-specific training obligation. (OSHA 1926.21; Safety Evolution, April 2026)
- Hazard Communication training under 29 CFR 1910.1200 requires employee training on chemical hazards at the time of initial assignment and when new hazards are introduced. This is one of the most frequently cited OSHA standards and one of the most common gaps in new-hire orientation programs that rely on generic content. (OSHA; BLS SOII 2024 top violations)
- OSHA penalties as of January 15, 2025: $16,550 maximum per serious violation and $165,514 per willful or repeated violation. An injury to an untrained worker can convert a regulatory compliance question into an enforcement proceeding with per-violation penalty accumulation across multiple untrained employees. (NAHB / OSHA, January 2025)
- OSHA released 2024 workplace injury and illness data from its Injury Tracking Application on April 17, 2025, including data from more than 732,000 Form 300 logs. This data is increasingly used to target inspection resources, making high-injury-rate worksites more likely to receive proactive inspections regardless of incident reporting patterns. (OSHA Trade Release, April 17, 2025)
Key Takeaways for Safety Managers and EHS Professionals
Sources
Government and Regulatory Sources
- BLS SOII January 22, 2026 (USDL-26-0101) – Employer-Reported Workplace Injuries and Illnesses 2023-2024: 2.3 TRC rate, 2.5M total cases, 2.2 injury rate, DART 1.4
- BLS IIF Home – 5,070 fatal work injuries in 2024 (CFOI, February 19, 2026), 3.3 per 100,000 FTE fatal rate
- OSHA Trade Release April 17, 2025 – 2024 injury and illness data: 370,000 Form 300A reports, 732,000+ Form 300/301 records released
- OSHA Business Case for Safety and Health – $1B/week workers’ comp (Liberty Mutual 2025 WSI); $1.3 trillion national work injury cost (2023)
Research and Industry Sources
- Chen, Sridhar, Han, Singh, Mittal, Im. Journal of Marketing (Sage), 2024 – 10% increase in training hours leads to 6.45-9.57% decrease in safety hazards; causal identification via catastrophic accidents
- NSC Injury Facts 2026 – TRC 2.3 (lowest since 2003), DART 1.4, DAFW 0.8; methodological caveats on lagging indicators
- NSC (January 30, 2026) – BLS Report: Workplace Injuries Hit 20-Year Low; “injuries tell a different story” analysis
- Humulo (March 2026) – New Hire Safety Orientation Playbook: 3x first-month injury risk (JOEM); 35% first-year share; 4-hour day-one minimum; 30-60-90 structure
- OHS Online / Occupational Health and Safety (November 2024) – Safety Stakes for New Hire Onboarding: 33% first-year share; Harvard Business Review 50% turnover influence; question-asking reluctance
- Safety Evolution (April 2026) – Safety Orientation Complete Guide: 29 CFR 1926.21(b)(2); Alberta OHS Act penalties; signed form limitations; OSHA inspector knowledge test
- OSHA Online Center (September 2025) – OSHA Training Statistics: 30-50% injury reduction; 80%+ knowledge improvement; $4-$6 ROI; 50% reduction with comprehensive training
- Yourco.io (May 2026) – Financial Case for Proactive Safety: $181.4B total injury cost 2024; $54.9B productivity loss; 1.8M DART cases; hidden cost multipliers
- Techclass (May 2026) – The $4 Return: $43,000 average medically consulted injury cost; $4-$6 ROI evidence base; regulatory enforcement context
- MEM Insurance (March 2026) – Complete New Hire Safety Onboarding Guide: buddy system rationale; question-asking reluctance; 30-60-90 check-in structure