
Tips: Leading and Lagging Indicators in Safety
Leading and lagging indicators in safety measure different things. Using only one type is like driving with your eyes on the rear-view mirror. These seven tips show you how to build a measurement system that actually prevents incidents.
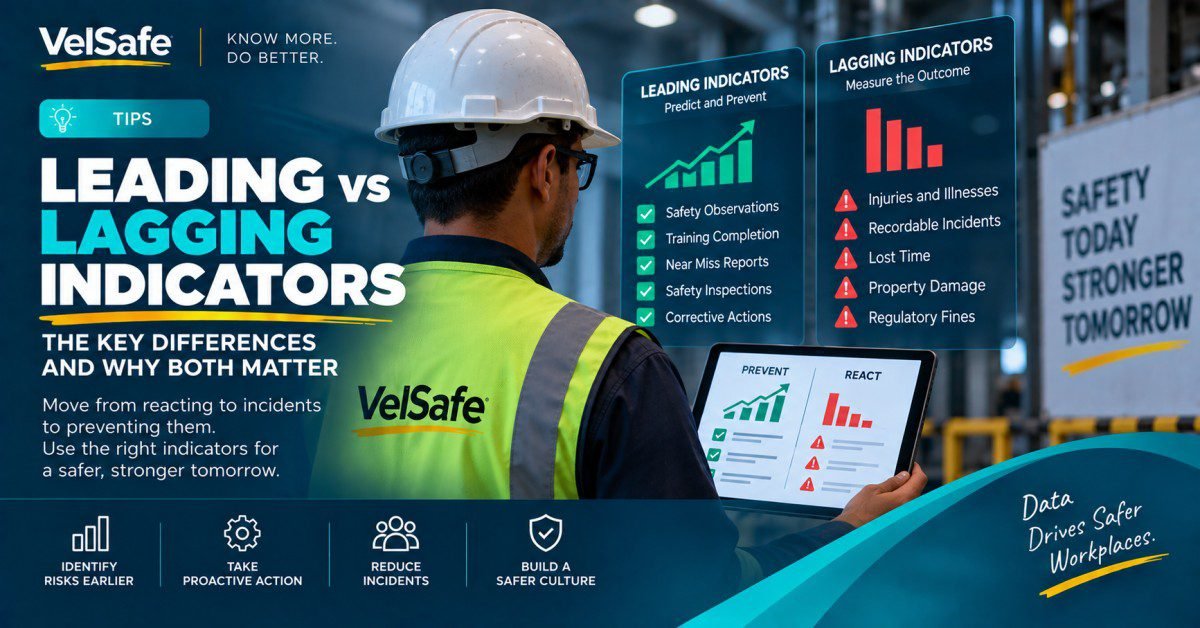
Leading and lagging indicators are the two fundamental measurement categories in occupational safety performance. Lagging indicators record what has already happened: injuries, illnesses, fatalities, days away from work. Leading indicators track what you are doing to prevent those outcomes: training completion, inspection frequency, near-miss reporting, corrective action close-out rates. Organisations that rely on lagging indicators alone are measuring failure after it occurs. Organisations that add leading indicators create the visibility to act before a serious incident happens. These seven tips cover how to select, track, and use both types effectively in a real safety programme.
0
Injuries in a Year Does Not Mean a Workplace Is Safe: It May Mean Incidents Went Unreported or Hazards Were Not Yet Triggered
A zero-injury year is a lagging indicator result. It tells you no recorded injuries occurred. It does not tell you whether near-misses went unreported, whether corrective actions were completed, or whether your hazard controls actually functioned. Without leading indicators, a clean lagging record is an incomplete picture. Source: OSHA: Measuring Safety Performance
TRIR
Total Recordable Incident Rate: The Most Common Lagging Indicator, Calculated Per 200,000 Hours Worked
TRIR = (Number of recordable incidents x 200,000) divided by total hours worked. It is the lagging indicator most frequently used in OSHA benchmarking, contractor prequalification, and insurance underwriting. A low TRIR is a necessary baseline. It is not a sufficient measure of safety programme effectiveness without accompanying leading metrics. Source: BLS: Occupational Injuries and Illnesses
Leading
Indicators Are Predictive: They Measure the Presence of Controls Before an Incident Occurs, Not After
OSHA’s recommended leading indicators include: safety observation completion rates, near-miss reporting frequency, corrective action close-out rates, training completion percentages, and hazard control verification. Each one measures an activity that, when done well, makes a recordable incident less likely. Source: OSHA: Leading Indicators
7 Leading and Lagging Indicators Tips: Quick Summary
What every safety manager needs to know
1
Understand what each indicator type actually measures: outcomes vs. activities
2
Never use lagging indicators alone: a zero-injury record does not confirm that hazards are controlled
3
Choose leading indicators that connect directly to your highest-risk activities
4
Track near-miss reporting rate as your single most important leading indicator
5
Set leading indicator targets that require action, not just data collection
6
Use lagging indicator trends to select and calibrate your leading indicators
7
Report both types to leadership together so the picture is complete and honest
Leading and Lagging Indicators Tips in Full
Tip 1: Know Exactly What Each Indicator Type Measures Before You Collect Any Data
Why It Matters
Lagging indicators measure outcomes: injuries, illnesses, days away from work, OSHA recordables, fatalities. They tell you the result of what your safety programme did or did not prevent. Leading indicators measure activities and system performance: the percentage of safety observations completed on schedule, the rate of near-miss reports per month, the proportion of corrective actions closed within their due date. They tell you whether the controls that should prevent those lagging outcomes are actually functioning. Confusing the two categories leads to metric selection errors that undermine the entire measurement programme. A company that tracks training completion as a lagging outcome rather than a leading activity will draw the wrong conclusions from its data. Source: OSHA: Measuring Safety Performance
What To Do
For every metric in your safety programme, apply the classification test: does this number change only after something bad has already happened? If yes, it is a lagging indicator. Does this number change when your team takes a preventive action, regardless of whether an injury occurs? If yes, it is a leading indicator. Write down your current safety metrics and classify each one. Most organisations discover they are tracking five to eight lagging indicators and two to three leading indicators, which is the inverse of an effective measurement mix. The goal is more leading indicators than lagging ones, connected to your highest-risk activities.
Common Mistake
Counting near-misses as a lagging indicator because they are “things that happened.” Near-misses are leading indicators: they reveal the presence of an uncontrolled hazard or a system failure before a recordable injury occurs. A rising near-miss report rate is a leading indicator that your reporting culture is improving and that your team is identifying risks. A falling near-miss rate when no other metrics have changed is a warning signal, not a positive trend.
Pro Tip
Use OSHA’s published leading indicator examples as your starting classification reference. OSHA’s Recommended Practices for Safety and Health Programs and the National Safety Council both publish lists of validated leading indicators by industry. Starting from these lists is faster and more accurate than building your own classification from scratch, and it gives you a defensible basis for your metric choices in regulatory conversations.
Tip 2: Stop Relying on Zero-Injury Records as Proof That Your Safety Programme Is Working
Why It Matters
A zero-recordable-injury year tells you that no OSHA-recordable injury was reported during that period. It does not tell you whether near-misses went unreported, whether workers avoided injury by luck rather than by controls, whether the hazard that will cause next year’s serious injury is already present but undetected, or whether your incident reporting system is functioning accurately. Some of the most catastrophic industrial incidents in US history occurred at facilities with years of clean lagging indicator records immediately before the event. Treating a low TRIR as evidence of a safe workplace rather than as one input into a broader measurement picture is a programme design error that creates false confidence. Source: OSHA: Safety and Health Programme Management
What To Do
When you present a zero-injury result in a leadership report or safety meeting, always present it alongside at least three leading indicators that validate the result. A zero-injury year combined with 94% inspection completion, 100% corrective action close-out within target, and a near-miss reporting rate of two per hundred workers per month is a defensible claim that the safety programme is functioning. A zero-injury year presented alone is an observation about past outcomes with no predictive value about future performance.
Common Mistake
Reducing safety programme investment or attention after a strong lagging indicator year on the assumption that the programme is working well. Lagging indicators are trailing measurements. By the time they reflect a decline, the conditions that caused that decline have been developing for weeks or months. A zero-injury year followed by reduced investment in training, inspection, and corrective action is a predictable precursor to a worse lagging indicator result in the following year.
Pro Tip
The most useful single check on your lagging indicator data quality is your near-miss reporting rate. If your organisation reports zero or very few near-misses in a period where TRIR is also low, you likely have a reporting problem, not an exceptionally safe workplace. Industry research consistently shows that for every recordable injury, there are multiple near-misses and many more hazardous conditions. A near-miss rate of zero is a data quality warning, not a success signal.
Tip 3: Choose Leading Indicators That Connect Directly to Your Highest-Risk Activities
Why It Matters
A leading indicator that does not connect to a hazard that could actually injure a worker in your specific workplace adds administrative burden without safety value. A construction company that tracks the percentage of administrative office staff attending a safety newsletter has a leading indicator. It is not a leading indicator for the fall fatality risk on its worksites. Every leading indicator you track should be answerable with: “If this number improves, which specific injury type becomes less likely, and why?” If you cannot answer that question for a metric, it is not functioning as a leading indicator in your programme. Source: OSHA: Recommended Practices: Measurement
What To Do
Start with your top three injury types or near-miss categories from the last three years of lagging data. For each one, identify the specific control that, if functioning correctly, makes that injury type less likely. Then build your leading indicator around the verification that the control is functioning: what is the frequency of control checks, who is verifying them, what percentage are passing on first inspection, and how fast are failures being corrected? A fall-prevention leading indicator for a construction programme might be: percentage of elevated worksites with 100% compliant fall protection verified by daily inspection. That metric directly measures the control status for your highest-risk injury type.
Common Mistake
Choosing leading indicators based on what is easiest to count rather than what connects to your real risk profile. Training completion rates are the most commonly tracked leading indicator because they are easy to pull from an LMS. They are also one of the weakest predictors of near-term incident prevention unless the training directly addresses a specific hazard that your lagging data shows is an active risk. Easy-to-measure is not the same as meaningful.
Pro Tip
Limit your leading indicator set to five to eight metrics. More than eight leading indicators typically means you have included metrics that are not genuinely predictive, and the volume of data collection undermines the quality of analysis. Fewer, better-chosen leading indicators tracked consistently produce more safety value than a large dashboard of metrics that no one has time to act on.
Tip 4: Track Near-Miss Reporting Rate as Your Single Most Important Leading Indicator
Why It Matters
A near-miss is an event that had the potential to cause a recordable injury but did not. Every near-miss is a piece of information about a real hazard or system failure that exists in your workplace right now. An organisation whose workers report near-misses actively is an organisation where hazard information is flowing upward before it becomes an injury. An organisation where near-misses are rarely or never reported is an organisation where that hazard information is staying with the worker who experienced it and going nowhere. Near-miss reporting rate is the single leading indicator most predictive of future incident rates because it directly measures whether your hazard identification system is functioning at the front line. Source: NSC: Near-Miss Reporting
What To Do
Make near-miss reporting as frictionless as possible: a simple paper or mobile form, a dedicated reporting channel, or a QR code that opens a short form directly. Set a target near-miss reporting rate for your organisation based on your workforce size and industry benchmarks. When a near-miss is reported, close the feedback loop within 48 hours: acknowledge the report, communicate what action will be taken, and follow up when the action is complete. Workers who report a near-miss and hear nothing back stop reporting. A functioning near-miss programme requires both a submission mechanism and a visible response cycle.
Common Mistake
Using near-miss data to identify and discipline the workers involved in the event rather than to fix the hazard or system failure that caused the event. This is the fastest way to end your near-miss reporting programme. If workers believe that reporting a near-miss results in blame rather than a corrective action, they will stop reporting. The moment near-miss reporting declines in response to a disciplinary reaction, your leading indicator has been destroyed and you have returned to learning exclusively from recorded injuries.
Pro Tip
Celebrate near-miss reporting publicly. Name and thank workers who report near-misses in safety meetings. Post what hazard was identified and what was fixed as a result of each report. When workers see that near-miss reports produce visible safety improvements, reporting rates increase naturally. This approach is documented by OSHA and the National Safety Council as one of the most cost-effective ways to improve leading indicator performance in a safety programme.
Tip 5: Set Leading Indicator Targets That Require Action, Not Just Data Collection
Why It Matters
A leading indicator with no target is a data point, not a management tool. Tracking inspection completion at 73% means nothing without a target that defines what “good” looks like and what happens when the number falls below it. Leading indicators become powerful when they are connected to thresholds that trigger a specific response: if corrective action close-out rate falls below 80% in any given month, the safety manager reviews all open items with supervisors in the following week’s meeting. Without that response mechanism, the metric is being collected but not used.
What To Do
For each leading indicator in your programme, define three things: a target level (what does good performance look like?), a threshold level (at what point does this number trigger a review or escalation?), and a response protocol (who acts, what do they do, and within what timeframe when the threshold is breached?). Write these down in your safety management plan and review them quarterly to confirm they are still calibrated to your current risk profile. A target set two years ago for a facility that has since doubled its workforce may no longer be appropriate.
Common Mistake
Setting leading indicator targets at whatever your current performance level is, then claiming you are meeting the target. A target of “complete at least 60% of scheduled safety observations” is not meaningful if your current rate is 58%. Targets need to be calibrated against what the literature and your industry benchmarks suggest is necessary to prevent the injury types in your risk profile, not against what your current resources are producing.
Pro Tip
Include leading indicator target performance in supervisor performance reviews. If a supervisor’s team consistently falls below the corrective action close-out rate target or the safety observation completion target, and there is no consequence or conversation attached to that performance, the target is decorative. Connecting leading indicator performance to the same accountability system as production performance is the structural change that makes leading indicators functionally different from decoration.
Tip 6: Use Lagging Indicator Trends to Select and Calibrate Your Leading Indicators
Why It Matters
Lagging indicators are retrospective but they are not useless. They contain information about where your safety system has been failing that leading indicators can then target. If your lagging data shows that 40% of recordable injuries over the last three years involved musculoskeletal strain during manual material handling, that pattern should be driving the selection of at least one leading indicator: the percentage of manual handling operations where ergonomic controls have been verified, or the rate of workstation assessments completed versus scheduled. Lagging data is the diagnostic input. Leading indicators are the corrective response. Using them in this sequence is the fundamental logic of an evidence-based safety measurement programme.
What To Do
At least once a year, conduct a lagging indicator analysis: pull your injury and near-miss data for the last 12 to 36 months, categorise incidents by injury type, body part, task, time of shift, location, and worker tenure. Identify the top three injury patterns. For each pattern, identify the specific control that should be preventing that injury type. Then verify whether you have a leading indicator that measures the functioning of that control. If you do not, add one. If you do, check whether its target level is calibrated against the severity of the injury pattern it is intended to prevent.
Common Mistake
Treating your leading indicator set as fixed and never updating it. The hazard profile of a workplace changes as operations change: new equipment, new chemicals, new work methods, seasonal workforce changes, and facility modifications all alter the risk landscape. A set of leading indicators built three years ago for different operations is not necessarily measuring the right things today. Annual calibration of leading indicators against current lagging data and current operational risk is a programme requirement, not an optional improvement.
Pro Tip
Map your leading indicators to your lagging indicator categories visually: a simple two-column table with each lagging indicator category on the left and the leading indicators designed to address it on the right. If any lagging indicator category has no corresponding leading indicator, your measurement programme has a gap. This mapping exercise also helps you communicate to leadership why each leading indicator is being tracked and what injury outcome it is designed to prevent.
Tip 7: Always Report Both Indicator Types Together So Leadership Gets the Complete Picture
Why It Matters
Leadership decisions about safety investment, programme priority, and resource allocation are made on the basis of safety data. If that data is only lagging indicators, leaders will only invest reactively, after injuries have occurred. If leading indicators are reported alongside lagging data, leaders can see where the programme is performing well, where it is under-resourced, and where a trend in a leading indicator is predicting a future change in the lagging outcome. A safety report that shows TRIR improving alongside a decline in inspection completion rates is a report that tells a predictive story: the improvement may reverse if the inspection completion trend continues. Reporting both together gives leadership the information to act before the reversal occurs. Source: OSHA: Recommended Practices
What To Do
Structure every safety report, whether monthly, quarterly, or annual, with lagging indicators in Section 1 and leading indicators in Section 2. In Section 2, annotate each leading indicator with its trend direction and its relationship to the lagging indicator it is designed to influence. For example: “Near-miss reporting rate increased from 1.2 to 2.4 per hundred workers this quarter. This reflects improved reporting culture and is expected to support the TRIR improvement sustained over the same period.” That annotation makes the leading indicator legible to a non-safety audience and demonstrates its value to leaders who are not familiar with safety measurement methodology.
Common Mistake
Reporting leading indicators only internally and presenting only lagging indicators to leadership. This reinforces the pattern of leadership evaluating safety programme performance exclusively on injury outcomes and making investment decisions reactively. Safety managers who want organisational investment in preventive safety activities need to make the leading indicator case directly to leadership, in the same report and in plain language that connects the leading activity to the lagging outcome it prevents.
Pro Tip
Use a dashboard format that shows each leading indicator alongside the lagging indicator it is intended to influence, with trend arrows for both. A dashboard where every leading indicator is paired with its linked lagging indicator makes the predictive relationship visible and gives leadership a tool for safety investment decisions that they can understand without safety management expertise. This format also makes it immediately visible when a leading indicator is declining ahead of a lagging indicator worsening, which is exactly the early warning signal the system is designed to provide.
Leading vs. Lagging Indicators: Quick Reference
Lagging Indicators
Leading Indicators
Measure outcomes after they occur
Reactive by nature
TRIR, DART, LTIR, fatality rate
OSHA 300 log recordables
Days away from work
Workers’ compensation claims
Property damage incidents
Useful for benchmarking and trend analysis
Reactive by nature
TRIR, DART, LTIR, fatality rate
OSHA 300 log recordables
Days away from work
Workers’ compensation claims
Property damage incidents
Useful for benchmarking and trend analysis
Measure preventive activities before incidents
Predictive and proactive
Near-miss reporting rate
Inspection and observation completion rate
Corrective action close-out rate
Safety training completion by task type
Hazard control verification rate
Useful for real-time programme management
Predictive and proactive
Near-miss reporting rate
Inspection and observation completion rate
Corrective action close-out rate
Safety training completion by task type
Hazard control verification rate
Useful for real-time programme management
Key Takeaways
Lagging indicators tell you what happened. Leading indicators give you the chance to prevent what comes next.
Neither type is optional. A safety programme that tracks only lagging indicators is measuring failure after it occurs. A safety programme that tracks only leading indicators has no outcome data to validate whether its preventive activities are actually working. The combination of both, with leading indicators selected to directly address the hazards your lagging data identifies, is the measurement architecture of an effective safety management system.
Near-miss reporting is the highest-value leading indicator available to most organisations and the easiest to undermine.
Near-miss reports contain real hazard information from real events in your actual workplace. A strong near-miss reporting programme, supported by visible management response and a no-blame reporting culture, generates a continuous stream of leading indicator data about conditions that could produce your next recordable injury. Destroying that programme through punitive responses to reports is one of the most common and most costly safety management errors.
A measurement programme that only looks backwards cannot prevent what is building right now
Every major industrial disaster in recorded safety history was preceded by conditions that leading indicators could have detected. Inspection completion rates were falling. Near-misses were not being reported. Corrective actions were overdue. The information was present in the system; it was not being measured, reported, or acted on. The purpose of leading indicators is not to add administrative work to a safety programme. It is to make visible the conditions that are building toward the next serious incident, while there is still time to prevent it.
Frequently Asked Questions
What is the difference between leading and lagging indicators in safety?
Leading indicators are proactive measures of safety programme activities that predict future incident rates: near-miss reporting rate, inspection completion, corrective action close-out rate, training completion for high-risk tasks. Lagging indicators are retrospective measures of safety outcomes that have already occurred: total recordable incident rate (TRIR), days away from work rate (DART), fatalities, and OSHA 300 log recordables. Leading indicators give you the opportunity to act before an injury occurs. Lagging indicators tell you how well the programme performed after the measurement period is complete. Source: OSHA: Measuring Safety Performance
What are the most common lagging indicators used in workplace safety?
The most widely used lagging indicators in occupational safety are: Total Recordable Incident Rate (TRIR), calculated as the number of OSHA-recordable incidents multiplied by 200,000 divided by total hours worked; Days Away, Restricted, or Job Transfer rate (DART); Lost Time Incident Rate (LTIR); fatality count; and workers’ compensation claims count and cost. These metrics are reported to OSHA, used in contractor prequalification processes, and referenced in insurance underwriting. They are valuable for benchmarking and trend analysis but provide no predictive information about future incident likelihood.
What are examples of leading indicators for workplace safety?
OSHA’s Recommended Practices for Safety and Health Programs identifies examples including: near-miss and hazard reporting rate, safety observation or inspection completion rate as a percentage of scheduled frequency, corrective action close-out rate within target timeframe, percentage of workers trained for their specific high-risk tasks, percentage of preventive maintenance completed on schedule for safety-critical equipment, and management safety walk frequency. Each of these measures an activity that, when consistently performed, makes a recordable incident statistically less likely. Source: OSHA: Leading Indicators
Is a near-miss a leading or lagging indicator?
Near-miss reporting rate is a leading indicator. A near-miss is an unplanned event that did not result in injury or recordable harm but had the potential to do so. The number of near-miss reports submitted in a given period is a measure of your hazard identification system’s sensitivity and your reporting culture’s strength. It reveals the presence of real hazards before they produce a recordable injury. This makes it predictive, which is the defining characteristic of a leading indicator. Near-miss count is sometimes misclassified as lagging because it involves something that happened, but the critical distinction is that it predicts future injury risk rather than recording a past injury outcome.
How many leading indicators should a safety programme track?
Most effective safety programmes track five to eight leading indicators. Fewer than five typically means the programme is not covering all of its high-risk activity categories. More than eight typically indicates that some metrics are not genuinely predictive of your specific injury risk profile, or that the data collection burden is too high for the analysis effort the metrics actually receive. Each leading indicator should be directly traceable to a specific injury type or hazard category in your lagging data. Indicators that cannot be linked to a real outcome should be replaced with ones that can.
Why do some companies have low injury rates but still have serious incidents?
A low TRIR or DART rate reflects the frequency of recorded injuries relative to hours worked. It does not reflect the severity potential of the hazards present in the workplace. A facility can have a low recordable injury rate while managing processes that carry catastrophic failure risk: high-pressure systems, combustible materials, elevated work, or confined spaces; if those hazards have not yet produced a recordable event. Many of the most devastating industrial incidents in US history occurred at facilities with years of low recorded injury rates. This is the core argument for leading indicators: they can reveal the gap between a clean lagging record and the actual hazard control status of high-risk operations.
What does OSHA say about using leading indicators?
OSHA’s Recommended Practices for Safety and Health Programs explicitly advocates for the use of leading indicators as part of a balanced safety measurement approach. OSHA states that organisations should not rely solely on injury and illness data to evaluate programme performance, because such data only tells you about past failures. OSHA recommends tracking leading indicators that measure whether programme elements are functioning, including hazard identification and control, training, communication, and worker participation. The OSHA guidance also recommends setting specific, measurable targets for leading indicators and reviewing progress regularly to identify where programme improvements are needed. Source: OSHA: Recommended Practices
Sources
Government and Regulatory Sources
- OSHA: Measuring Safety Performance: OSHA’s primary guidance on leading and lagging indicator selection, the case for using both types together, and examples of effective leading indicators for safety and health programmes. The foundational regulatory reference for this article’s recommendations.
- OSHA: Recommended Practices for Safety and Health Programs: OSHA’s comprehensive guidance on safety management system design, including the measurement chapter that covers leading and lagging indicator programme architecture.
- Bureau of Labor Statistics: Injuries, Illnesses, and Fatalities: source for TRIR calculation methodology, DART rate formula, and occupational injury and illness survey data used in industry benchmarking of lagging indicators.
Standards and Industry Sources
- National Safety Council: Near-Miss Reporting: NSC guidance on near-miss reporting programme design, the relationship between near-miss reporting culture and recordable incident rates, and best practices for closing the feedback loop with workers who submit near-miss reports.
Related VelSafe Articles
Tips
10 Incident Investigation Tips for Safety Managers
How to investigate recordable incidents effectively: root cause analysis methods, witness interviews, corrective action development, and the documentation that turns a lagging indicator event into leading indicator improvements.
Situational
Warehouse Safety: Inspections and Observations Case Study
A real-scenario case study of how inspection and observation completion rates (leading indicators) failed to detect a building hazard condition, with root cause analysis and the corrective actions that followed the incident.
Worker Safety
Injury and Illness Prevention Program: IIPP Guide
The complete framework for building an Injury and Illness Prevention Program, covering the measurement system architecture that integrates leading and lagging indicators into a structured safety management programme.
Safety Programme Measurement and Management Resources
More Safety Management Tips for Supervisors and EHS Professionals
VelSafe covers safety programme design, OSHA compliance, incident investigation, and safety measurement for frontline supervisors, safety coordinators, and EHS managers across general industry, construction, healthcare, and high-hazard operations.
Browse All Safety Tips