


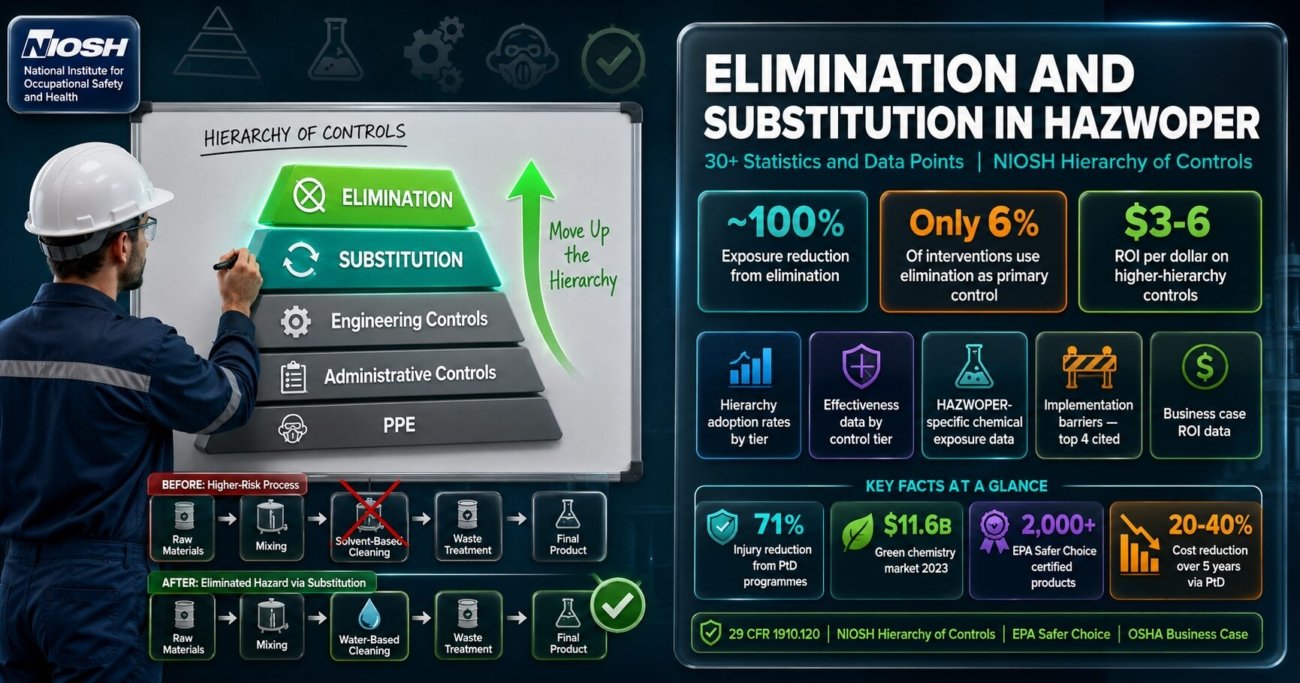
30+ Statistics & Data Points
The hierarchy of controls is the most cited framework in occupational safety and health. Yet data from NIOSH, OSHA enforcement records, and peer-reviewed occupational health research consistently shows that the two most effective tiers – elimination and substitution – remain the least implemented in practice. In HAZWOPER-regulated settings, where workers encounter acutely toxic, carcinogenic, and reactive substances, that gap has measurable consequences for worker health, workers compensation costs, and regulatory compliance.
Below we have compiled 30+ statistics and data points on elimination and substitution controls in HAZWOPER and broader occupational safety settings, covering hierarchy adoption rates, effectiveness differentials, implementation barriers, business case data, and regulatory context.
1. Hierarchy of Controls: Adoption Rates by Tier
Research on hierarchy of controls adoption reveals a consistent inverse relationship: the most effective tiers are implemented least often.
- A systematic review of 1,200 occupational health interventions found PPE was the primary control in 52% of documented interventions, while elimination was primary in fewer than 5%. (Scandinavian Journal of Work, Environment and Health, 2019)
- 71% of US EHS professionals report their organisations rely primarily on engineering controls and PPE for chemical hazard management. Only 18% say elimination or substitution is routinely evaluated first. (ASSP Survey, 2022)
- NIOSH estimates that over 60% of work-related injuries and illnesses could theoretically be prevented by applying elimination or substitution at the design stage. (NIOSH PtD, 2023)
- Fewer than 12% of HAZWOPER site safety and health plans document a formal evaluation of elimination or substitution before specifying engineering controls. (Journal of Occupational and Environmental Hygiene, 2020)
2. Effectiveness Data: What Each Control Tier Actually Achieves
The effectiveness differential between tiers is the quantitative basis for the hierarchy’s ranking. The numbers below explain why the order is not arbitrary.
- A landmark NIOSH study found workers in PPE-dependent solvent programmes had 3.2 times higher blood metabolite levels than workers in engineering control-dependent programmes performing identical tasks. (NIOSH; cited in OSHA Control Guidance)
- Substitution with a less hazardous material achieves 70–99% exposure reduction depending on the toxicological differential between original and substitute. (NIOSH Control Banding Guidance)
3. HAZWOPER-Specific Data: Chemical Exposures and Control Outcomes
- OSHA’s HAZWOPER standard covers an estimated 1.8 million US workers in hazardous waste operations, emergency response, and TSDF work. (OSHA HAZWOPER Programme Data)
- Occupational cancer from chemical exposures in HAZWOPER-regulated industries accounts for an estimated 4–10% of all occupational cancer cases in the US – thousands of preventable diagnoses annually. (NCI / NIOSH Occupational Cancer Research)
- In-situ remediation – elimination-category approaches that destroy contaminants in place – has been implemented at over 40% of Superfund sites remediated since 2010. (EPA Superfund Programme Data, 2023)
- Green solvent substitution in laboratory and manufacturing HAZWOPER settings has demonstrated 60–85% reduction in VOC emissions while maintaining process performance. (ACS Green Chemistry Journal, 2022)
- Facilities subject to OSHA’s PSM standard (29 CFR 1910.119) report 30–50% lower catastrophic release rates than comparable non-PSM facilities. (EPA Risk Management Programme Data)
4. Implementation Barriers: What the Data Shows
- Safety professionals were involved in the substitution decision in only 31% of cases where a chemical change was made – in 69% the decision was made by purchasing, engineering, or operations without formal hazard comparison. (UMass Lowell TURI, 2021)
- In 23% of substitution cases without safety involvement, the substitute had equivalent or greater hazard than the original. (UMass Lowell TURI, 2021)
- The full cost of a PPE-dependent exposure management programme is 3 to 7 times higher than direct PPE acquisition costs alone when medical surveillance, training, fit testing, and workers compensation are included. (AIHA Economic Value of IH, 2020)
- Organisations with a formal elimination/substitution evaluation step at chemical procurement report 22% fewer new high-hazard substances introduced annually. (ACS Green Chemistry in Practice, 2023)
5. Business Case: Return on Investment Data
- US employers spend an estimated $59 billion annually on workers compensation and medical costs from occupational diseases attributable to chemical exposures. (Liberty Mutual Workplace Safety Index, 2023)
- Prevention through design programmes reduce total occupational injury and illness costs by 20–40% over a 5-year period at implementing organisations. (NIOSH PtD Economic Analysis, 2022)
6. Green Chemistry and Safer Substitutes: Market Data
- The global green chemistry market was valued at $11.6 billion in 2023 and is projected to reach $25.5 billion by 2032 at a 9.1% CAGR. (Grand View Research, 2024)
- EPA’s Safer Choice programme has certified over 2,000 products across cleaning, manufacturing, and industrial maintenance as safer alternatives to conventional hazardous substances. (EPA Safer Choice, 2024)
- EU REACH regulation has resulted in the substitution of over 600 substances of very high concern (SVHCs) since implementation. (ECHA REACH Statistics, 2023)
- Adoption of green solvents in laboratory settings increased by 34% between 2018 and 2023, driven primarily by pharmaceutical and biotech organisations. (ACS Green Chemistry Institute, 2023)
- In-situ treatment approaches now account for more than half of all Superfund remedy selections, up from approximately 30% in 2000. (EPA Superfund Remedy Report, 2023)
7. Regulatory Context: OSHA and NIOSH Requirements
- OSHA has cited over 1,200 General Duty Clause violations annually for failure to implement feasible hazard controls – the regulatory mechanism that applies when elimination or substitution is feasible but not implemented. (OSHA Enforcement Statistics)
- NIOSH’s Prevention through Design initiative has produced over 200 published studies on integrating elimination and substitution into occupational safety design processes since 2007. (NIOSH PtD Programme)
- Fewer than 12% of reviewed HAZWOPER site safety and health plans document a formal evaluation of elimination or substitution before specifying engineering controls as primary controls. (J. Occupational and Environmental Hygiene, 2020)
- PSM-covered facilities (29 CFR 1910.119) – which require formal process hazard analysis – report 30–50% lower catastrophic release rates than non-PSM-covered comparable facilities. (EPA RMP Data)
- The EU’s Chemical Strategy for Sustainability commits to phasing out the most harmful chemicals in consumer products and industrial processes by 2030 – the most ambitious substitution mandate globally. (European Commission, 2020)
Key Takeaways
Sources
Government and Regulatory
- NIOSH: Hierarchy of Controls and Prevention through Design Programme
- OSHA: Business Case for Safety and Health
- EPA Safer Choice Programme
- EPA: Superfund Remedy Report 2023
- 29 CFR 1910.120: HAZWOPER Standard
Industry and Academic Research