VelsafeVelsafe

Workplace Safety Guides, Insights & Training

Velocity Safe Blog
  • Sign in /
  • join
  • Home
  • Insights
  • Guides
  • Practice Tests
  • Tips
  • Worker Safety
  • Situational
  • OSHA Tools
  • Law

Home » Insights » Page 6

Insights

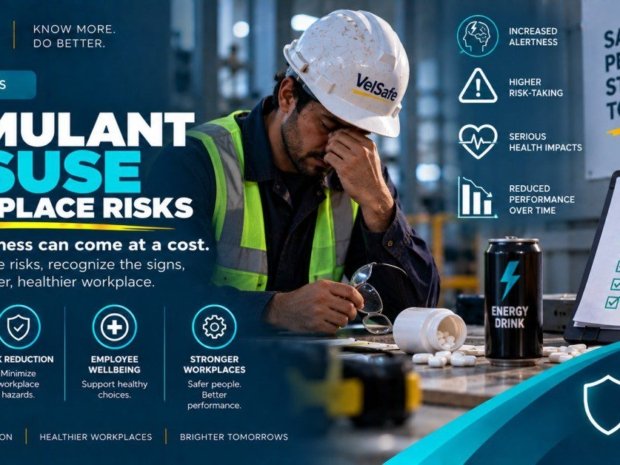
Worker in hard hat showing signs of fatigue beside energy drink and pills illustrating prescription stimulant misuse workplace risks
August 27, 2025
by VelSafe Editorial Team Insights

Prescription Stimulant Misuse Workplace Risks: Evidence 2026

Read More
FDA drug application rejection statistics infographic showing 291 published Complete Response Letters, 74% manufacturing deficiency rate, 56% facility inspection failures, and 48% safety-efficacy co-occurrence rate from the FDA's 2025 radical transparency initiative covering 2020-2025 applications.
August 20, 2025
by VelSafe Editorial Team Insights

FDA Drug Application Rejections: 40+ Statistics from 291 Published CRLs

Read More
Hazmat road incident statistics infographic showing 119,346 U.S. highway hazmat incidents from 2021 to 2026, 87% highway share of all incidents, 50% flammable liquid involvement, and 2025 PHMSA penalty increases to $238,000 per violation, based on DOT PHMSA data.
August 15, 2025
by VelSafe Editorial Team Insights

Hazmat Road Incidents in the U.S.: 40+ Statistics Through 2025

Read More
cGMP violations dietary supplement manufacturing infographic showing 46% increase in FDA 483 observations from 2023 to 2024, 33% of facilities cited for specification failures, 600 FY2024 inspections covering approximately 5% of 13,000-15,000 registered facilities, based on FDA data and FOIA records.
August 12, 2025
by VelSafe Editorial Team Insights

cGMP Violations in Dietary Supplement Manufacturing: 40+ Statistics Through 2025-26

Read More
Defensive versus aggressive driving crash risk statistics for 2025 showing 56 percent of fatal crashes involve aggressive driving, 12151 speeding deaths in 2022, 80 percent of drivers expressing road rage, three times higher crash rate for aggressive drivers versus defensive drivers and 38 percent crash rate reduction from defensive driving training
August 3, 2025
by VelSafe Editorial Team Insights

Defensive vs Aggressive Driving: 30+ Crash Risk Statistics (2025 Update)

Read More
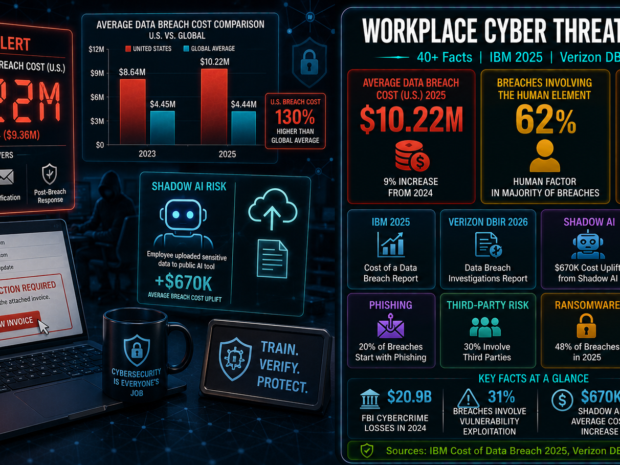
Workplace cyber threat statistics infographic showing $10.22M average U.S. data breach cost (IBM 2025), 62% human element involvement (Verizon DBIR 2026), 48% ransomware prevalence, $670,000 shadow AI breach cost increase, and vulnerability exploitation overtaking credential abuse as the #1 initial access vector.
August 2, 2025
by VelSafe Editorial Team Insights

Workplace Cyber Threats by the Numbers: 40+ Statistics From IBM 2025 and Verizon DBIR 2026

Read More
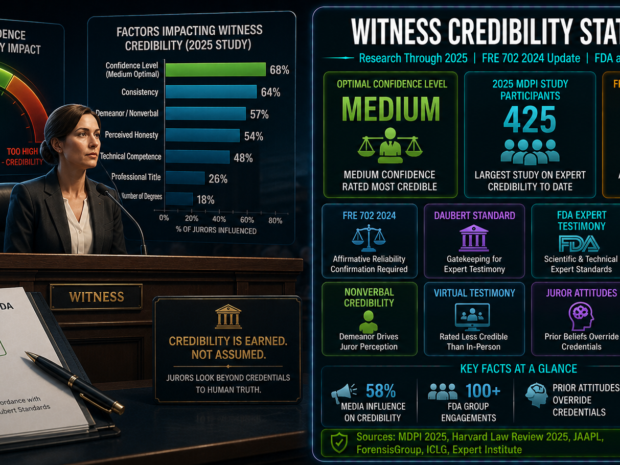
Witness credibility in regulatory trials infographic showing optimal medium confidence levels for juror credibility ratings, 2024 Federal Rule of Evidence 702 amendment requiring affirmative reliability confirmation, 2025 MDPI research on juror attitudes overriding expert credentials, and FDA and OSHA expert witness practice standards.
July 30, 2025
by VelSafe Editorial Team Insights

Courtroom Conduct and Credibility: What Research and Regulatory Practice Tell Us About Witness Impact

Read More
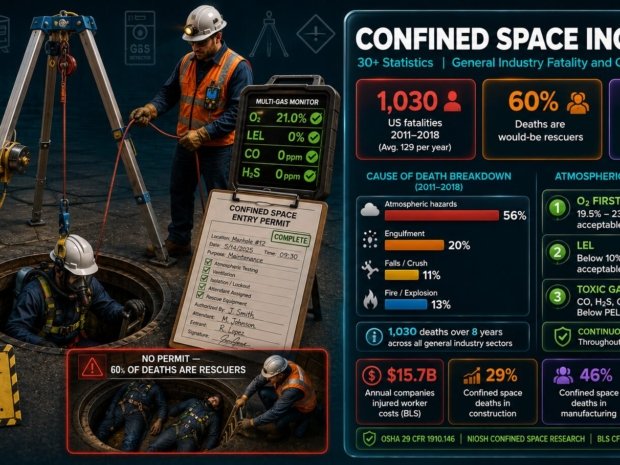
Confined space incident statistics showing 1030 US fatalities 2011 to 2018 averaging 129 per year with 60 percent being would-be rescuers, cause of death breakdown showing 56 percent atmospheric hazards, industry distribution data, and OSHA 29 CFR 1910.146 atmospheric monitoring requirements
July 30, 2025
by VelSafe Editorial Team Insights

Confined Space Incidents in General Industry: 30+ Statistics on Fatalities, Causes, and Compliance

Read More
Yellow hard hat and work gloves on concrete masonry blocks at US construction site with injury statistics dashboard showing falls, struck-by objects, equipment-related and material handling injury categories
July 25, 2025
by VelSafe Editorial Team Insights

Concrete and Masonry Construction Injuries: 30+ Statistics

Read More
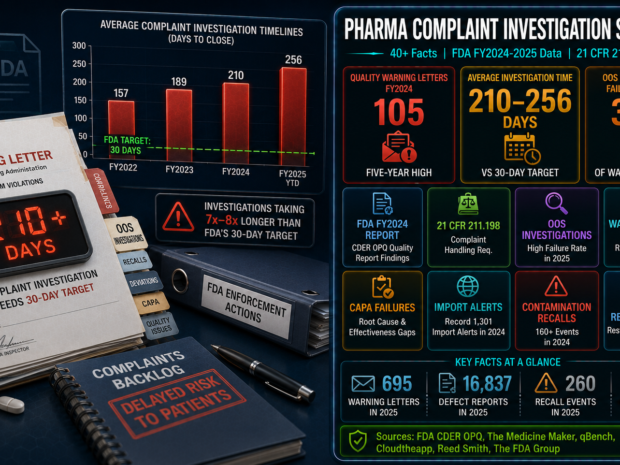
Pharmaceutical complaint investigation backlog statistics infographic showing 210-256 day average investigation timelines against a 30-day target, 105 FDA quality warning letters in FY2024 (a five-year high), 34% OOS investigation failure rate in 2025 warning letters, and 695 total FDA enforcement letters in 2025, based on FDA CDER OPQ FY2024 quality report and qBench analysis.
July 24, 2025
by VelSafe Editorial Team Insights

Pharma Complaint Investigation Backlogs: 40+ Statistics Through 2025-26

Read More
  • First
  • Previous
  • 1
  • ...
  • 4
  • 5
  • 6
  • 7
  • 8
  • Next
  • Last

Subscribe Now

VelSafe Subscribe
VelsafeVelsafe

Workplace Safety Guides, Insights & Training

Linkedin Twitter Instagram
Category
  • Insights
  • Guides
  • TIPS
  • LAW
  • Practice Tests
  • SITUATIONAL
Info
  • About Us
  • Get Featured
  • Newsletter
  • Contact Us
Popular Posts
Legal books showing OHS laws, industry regulations, and crane standards beside a yellow mobile crane at oil and gas refinery illustrating OSHA crane operations law requirements including operator certification, inspection records, and compliance enforcement
September 25, 2026

Oil and Gas Crane Operations Law:…

Oil and gas bloodborne pathogens 29 CFR 1910.1030 law article showing two oil and gas workers in hard hats and high-visibility vests at an industrial refinery site, with one worker kneeling beside a red first aid kit and holding an OSHA document on occupational exposure to bloodborne pathogens, with infographic panels below covering exposure control plan, PPE, hepatitis B vaccination, post-exposure evaluation, annual training, and recordkeeping requirements
September 19, 2026

Oil and Gas Bloodborne Pathogens: 29…

Newsletter

Send us a newsletter to get update


    © 2026 . All rights reserved.
    Shopping Basket